Category:Control charts
Zur Navigation springen
Zur Suche springen
Art von Diagramm  | |||||
| Medium hochladen | |||||
| Ist ein(e) |
| ||||
|---|---|---|---|---|---|
| Unterklasse von | |||||
| Aspekt von | |||||
| |||||
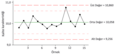
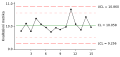
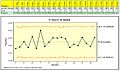
The control chart also known as the Shewhart chart or process-behaviour chart in statistical process control tool used to determine whether a manufacturing or business process is in a state of statistical control or not.
Unterkategorien
Es werden 6 von insgesamt 6 Unterkategorien in dieser Kategorie angezeigt:
In Klammern die Anzahl der enthaltenen Kategorien (K), Seiten (S), Dateien (D)
C
- C-chart (1 D)
I
M
N
- Nelson control chart rules (9 D)
R
- Control charts created with R (10 D)
W
- Western Electric rules (5 D)
Medien in der Kategorie „Control charts“
Folgende 26 Dateien sind in dieser Kategorie, von 26 insgesamt.
-
 2005 12 20 Klimaanlage schmatisch.jpg 1.110 × 961; 92 KB
-
 Control Chart (tr).png 2.000 × 938; 64 KB
-
 Control Chart1 Fig9.jpg 528 × 347; 14 KB
-
 Control Chart2 Fig10.jpg 528 × 347; 14 KB
-
 Control Chart3 Fig11.jpg 528 × 347; 14 KB
-
 Control Chart4 Fig12.jpg 528 × 347; 15 KB
-
 ControlChart cz.svg 520 × 244; 16 KB
-
 ControlChart.svg 520 × 244; 16 KB
-
 Diagram Kontrol.JPG 825 × 436; 49 KB
-
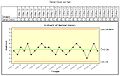 Diagram-c.jpg 677 × 430; 134 KB
-
 Diagram-u.jpg 729 × 427; 130 KB
-
 En.wp Featured Article Candidates FAC yield control chart.png 964 × 524; 25 KB
-
 En.wp Featured Article Candidates FACs submitted control chart.png 1.504 × 817; 50 KB
-
 En.wp Featured Article Candidates FAs promoted control chart.png 1.504 × 817; 50 KB
-
 Figura 9.4.png 915 × 307; 11 KB
-
 Grafik cusum.GIF 564 × 211; 4 KB
-
 Grafik EWMA.gif 558 × 215; 4 KB
-
 Grafik ZMR.JPG 733 × 444; 64 KB
-
 IMR Chart.jpeg 563 × 377; 131 KB
-
 Levy-Jennings SampleChart.png 778 × 449; 19 KB
-
 Npchart.JPG 867 × 449; 61 KB
-
 PChart.jpg 861 × 509; 204 KB
-
 Powerplant-piraeus-55 hg.jpg 4.928 × 2.763; 2,98 MB
-
 XBarR Chart.jpg 591 × 388; 149 KB
-
 XBarS Chart.jpg 797 × 492; 307 KB
-
 Xquer Regelkarte.svg 520 × 244; 17 KB

.png)


