Category:Demographics of Japan
跳转到导航
跳转到搜索
亚洲国家:阿富汗 · 阿拉伯联合酋长国 · 阿曼 · 阿塞拜疆‡ · 埃及‡ · 巴基斯坦 · 巴林 · 不丹 · 朝鲜民主主义人民共和国 · 大韩民国 · 东帝汶 · 俄罗斯‡ · 菲律宾 · 格鲁吉亚‡ · 哈萨克斯坦‡ · 吉尔吉斯斯坦 · 柬埔寨 · 卡塔尔 · 科威特 · 老挝 · 黎巴嫩 · 马尔代夫 · 马来西亚 · 蒙古国 · 孟加拉国 · 缅甸 · 尼泊尔 · 日本 · 塞浦路斯‡ · 沙特阿拉伯 · 斯里兰卡 · 塔吉克斯坦 · 泰国 · 土耳其‡ · 土库曼斯坦 · 文莱 · 乌兹别克斯坦 · 新加坡 · 叙利亚 · 亚美尼亚‡ · 也门 · 伊拉克 · 伊朗 · 以色列 · 印度 · 印度尼西亚‡ · 约旦 · 越南 · 中华人民共和国
有限承认:巴勒斯坦 · 中华民国 – 其他地区:澳门 · 香港
‡:部分位于亚洲
有限承认:巴勒斯坦 · 中华民国 – 其他地区:澳门 · 香港
‡:部分位于亚洲
日本語: 日本の人口統計 に関するカテゴリ
demographics of country | |||||
| 上传媒体 | |||||
| 隶属于 |
| ||||
|---|---|---|---|---|---|
| 上级分类 | |||||
| 位置 | 日本 | ||||
| |||||
子分类
本分类有以下22个子分类,共有22个子分类。
分类“Demographics of Japan”中的媒体文件
以下48个文件属于本分类,共48个文件。
-
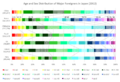 Age and Sex Distribution of Major Foreigners in Japan en.png 1,174 × 805;140 KB
-
 Age and Sex Distribution of Major Foreigners in Japan ja.png 1,174 × 805;140 KB
-
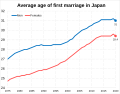 Average age of first marriage in Japan.svg 2,266 × 1,769;12 KB
-
 Bdrates of Japan since 1950 de.svg 512 × 320;25 KB
-
 Bdrates of Japan since 1950.svg 512 × 320;24 KB
-
 Birth and death rate of japan 1950-2019.png 1,151 × 645;39 KB
-
 BirthDeath 1950 JP.svg 480 × 320;8 KB
-
 Crude birth and death rate of Japan (1946-2019).png 2,845 × 1,402;99 KB
-

-

-
 Demografia Giappone (ita).png 1,097 × 599;66 KB
-
 Demographics of Japan.fa.jpg 521 × 329;42 KB
-
 Demography of the Sendai Domain.jpg 2,339 × 1,652;236 KB
-
 Demography of the Sendai Domain.tif 2,339 × 1,652;310 KB
-
 Divorce rates per 1000 of total population in Japan.svg 2,271 × 1,658;7 KB
-
 Foreign residents in Japan.svg 1,080 × 540;249 KB
-
 Historical population of Japan.svg 850 × 600;48 KB
-
 Irene B. Taeuber Population of Japan 1958 title.jpg 1,727 × 2,360;511 KB
-
 Japan Abortion Rate.svg 750 × 560;12 KB
-
 Japan's Aging Population .gif 475 × 302;10 KB
-
 Japanese demographics editted.png 1,097 × 599;77 KB
-
 Live births and deaths of Japan (1946-2019).png 2,845 × 1,402;205 KB
-
 Marriage rate per 1000 people in Japan.svg 2,365 × 1,661;15 KB
-
 Marriages in Japan over time.svg 2,365 × 1,661;16 KB
-
 Number of Births and Birthrate, Japan.svg 640 × 480;8 KB
-
 Number of Births and Deaths, Japan.svg 640 × 480;8 KB
-
 Number of births by age groups in Japan.svg 2,818 × 2,032;17 KB
-
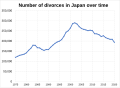 Number of divorces in Japan over time.svg 2,272 × 1,658;15 KB
-
 Percentage of households which are one person households in Tokyo.svg 2,301 × 1,674;15 KB
-
 Percentage of Japan who had No nationality stated in 2020.svg 512 × 569;84 KB
-
 Percentage of Japan who is of Foreign nationality in 2020.svg 512 × 569;84 KB
-
 Percentage of Japan who is of Japanese nationality.svg 512 × 569;84 KB
-
 Population Trends in Japan, by Age.svg 900 × 450;119 KB
-
 RNI 1950 JP.svg 480 × 304;7 KB
-
 Tasas de nacimientos y muertes en Japón.png 510 × 560;40 KB
-
 Total fertility rate of Japan overtime to 2016.svg 850 × 600;45 KB
-
 出産時の母親の年齢階級別割合の推移.jpg 811 × 468;73 KB
-
 在日外国人(2023年).png 3,230 × 1,701;974 KB
-
 就職氷河期.jpg 503 × 424;117 KB
-
 就職氷河期世代の誕生年度.png 516 × 573;17 KB
-
 平成24年10月1日人口と昭和60年基準人口モデル.png 657 × 402;14 KB
-
 日本の出生数と出生率1900-2010.jpg 1,398 × 909;216 KB
-
 日本の出生数と合計特殊出生率1947-2018.jpg 1,256 × 821;156 KB
-
 日本の出生数と合計特殊出生率(1947年~2019年).png 1,527 × 997;60 KB
-
 昭和60年人口モデル.png 656 × 400;11 KB
-
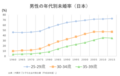 男性の年代別未婚率の推移(日本).png 1,291 × 820;79 KB
-
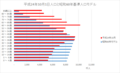
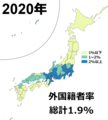 都道府県別の外国籍者率(2020年).png 975 × 1,083;150 KB
-
 都道府県別合計特殊出生率.png 5,654 × 1,400;826 KB


.png)


.png)


.png)


