Category:Economy of Brazil
Pereiti į navigaciją
Jump to search
economy of the country | |||||
| Įkelti mediją | |||||
| Tai yra | |||||
|---|---|---|---|---|---|
| Poklasis | |||||
| Valiuta |
| ||||
| PPP GDP per capita |
| ||||
| GDP (PPP) |
| ||||
| Nominalusis BVP |
| ||||
| Nominal GDP per capita |
| ||||
| Real GDP growth rate |
| ||||
| Inflation rate |
| ||||
| Total reserves |
| ||||
| Vieta | Brazilija | ||||
| |||||
Brazilija | ||
|---|---|---|
| ||
|
Subkategorijos
Rodoma 60 subkategorijų (iš viso yra 60 subkategorijų).
Daugialypės terpės rinkmenos kategorijoje „Economy of Brazil“
Rodomi 62 šios kategorijos rinkmenos (iš viso kategorijoje yra 62 rinkmenos).
-
 (2.7) Produto interno bruto nominal do Brasil.png 16 300 × 6 410; 1,66 MiB
-
 (2.8) Dívida pública geral do Brasil.png 16 300 × 6 410; 1,48 MiB
-
 (2.8) Produto interno bruto nominal do Brasil.png 16 300 × 6 410; 1,65 MiB
-
 (2.9) Produto interno bruto real do Brasil.png 16 300 × 6 410; 1,76 MiB
-
 2018, Brazil's constant Gross Domestic Product per capita growth, 2010 BRL.png 11 792 × 2 803; 753 KiB
-
 2018, Brazil's constant Gross Domestic Product per capita growth, 2010 USD.png 11 792 × 2 804; 674 KiB
-
 2018, Brazil's sectorial composition (update 1).png 10 125 × 3 333; 786 KiB
-
 2018, Brazil's sectorial composition.png 10 458 × 2 803; 947 KiB
-
 2019, Brazil's constant Gross Domestic Product growth, 2010 BRL.png 11 792 × 2 804; 622 KiB
-
 2019, Brazil's constant Gross Domestic Product growth, 2010 USD.png 11 792 × 2 804; 551 KiB
-
 2019, Brazil's constant Gross Domestic Product, 2010 BRL.png 10 458 × 2 804; 345 KiB
-
 2019, Brazil's constant Gross Domestic Product, 2010 USD.png 10 458 × 2 804; 312 KiB
-
 2019, Brazil's general gross debt (update 1).png 4 125 × 2 938; 453 KiB
-
 2019, Brazil's general gross debt (update 2).png 4 185 × 2 938; 517 KiB
-
 2019, Brazil's general gross debt.png 4 125 × 2 938; 391 KiB
-
 2019, Brazil's Gross Domestic Product growth rate, quarterly and yearly (update 1).png 15 792 × 3 738; 1,93 MiB
-
 2019, Brazil's Gross Domestic Product growth rate, quarterly and yearly (update 10).png 18 187 × 3 738; 2,44 MiB
-
 2019, Brazil's Gross Domestic Product growth rate, quarterly and yearly (update 2).png 15 792 × 3 738; 1,95 MiB
-
 2019, Brazil's Gross Domestic Product growth rate, quarterly and yearly (update 3).png 15 792 × 3 738; 2 MiB
-
 2019, Brazil's Gross Domestic Product growth rate, quarterly and yearly (update 4).png 15 792 × 3 738; 1,96 MiB
-
 2019, Brazil's Gross Domestic Product growth rate, quarterly and yearly (update 5).png 15 792 × 3 738; 1,99 MiB
-
 2019, Brazil's Gross Domestic Product growth rate, quarterly and yearly (update 6).png 18 125 × 3 738; 2,3 MiB
-
 2019, Brazil's Gross Domestic Product growth rate, quarterly and yearly (update 7).png 18 187 × 3 738; 2,57 MiB
-
 2019, Brazil's Gross Domestic Product growth rate, quarterly and yearly (update 8).png 18 187 × 3 738; 2,52 MiB
-
 2019, Brazil's Gross Domestic Product growth rate, quarterly and yearly (update 9).png 18 187 × 3 738; 2,52 MiB
-
 2019, Brazil's Gross Domestic Product growth rate, quarterly and yearly.png 22 792 × 3 738; 1,5 MiB
-
 5tendencias.jpg 1 413 × 1 181; 243 KiB
-
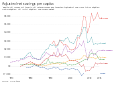 Adjusted net savings per capita, OWID.svg 850 × 600; 19 KiB
-
 Bovespa.svg 234 × 60; 15 KiB
-
 Brazil can into economy.png 621 × 1 055; 30 KiB
-
 Cartao bolsa escola.jpg 156 × 122; 18 KiB
-
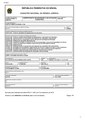 CNPJ Example.pdf 1 237 × 1 752; 110 KiB
-
 CNPJ Oracle SP.png 368 × 234; 67 KiB
-
 COBRIMEX SIV02.jpg 1 280 × 960; 320 KiB
-
 Comércio Exterior do Brasil 1921-1925.djvu 3 042 × 4 312, 260 puslapių; 13,15 MiB
-
 Crescimento do PIB do Brasil entre 2010 e 2016.png 714 × 434; 27 KiB
-
 Cresol logo.jpg 217 × 105; 20 KiB
-
 Cresol sede.jpg 250 × 166; 36 KiB
-
 Debating deindustrialization- a comparative analysis of Brazil and Mexico (IA debatingdeindust1094543936).pdf 1 275 × 1 650, 88 puslapiai; 1,2 MiB
-
 Dia do Trabalho.jpg 2 256 × 863; 1,06 MiB
-
 Economical notes on Brazil (IA economicalnoteso00brazrich).pdf 833 × 1 304, 116 puslapių; 4,3 MiB
-
 Estaleiro Atlântico Sul - Ipojuca, Pernambuco.jpg 1 460 × 1 061; 296 KiB
-
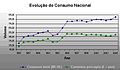 Evolução do consumo Nacional.JPG 478 × 278; 23 KiB
-
 Exportaciones - Brasil - Ano.png 758 × 480; 22 KiB
-
 GDP variation Brazil.png 894 × 369; 52 KiB
-
 GDP-top-counties.gif 531 × 311; 28 KiB
-
 Grafico captacao recursos abcnas.jpg 605 × 398; 43 KiB
-
 Importaciones - Brasil - Ano.png 758 × 480; 21 KiB
-
 Imports of goods and services (% of GDP) - 2022 - World Bank.png 400 × 922; 37 KiB
-
 IMPOSTÔMETRO.jpg 4 000 × 3 000; 3,01 MiB
-
 Maury Geography 092A mules.jpg 974 × 643; 114 KiB
-
 Ministerio de Desarrollo, Industria y Comercio Exterior de Brasil.svg 360 × 240; 23 KiB
-
Ministério do Planejamento projeta salário mínimo de R$ 667 em 2013.webm 2 min 45 s, 640 × 480; 8,45 MiB
-
 Pbi per capita.png 794 × 459; 90 KiB
-
 Predio intelig praia de botafogo.jpg 450 × 950; 124 KiB
-
 Sky device.jpg 3 205 × 981; 2,45 MiB
-
 Sonegometro.jpg 4 116 × 2 877; 1,71 MiB
-

-
 Tiago Társis Reforma da Feira.jpg 800 × 531; 107 KiB
-
 Variação do PIB do Brasil entre 1967 e 2016.png 894 × 369; 52 KiB
-
 巴西出口到新加坡的产品 (1995 - 2015).svg 1 056 × 488; 1,47 MiB
-
 新加坡出口到巴西的产品 (1995 - 2015).svg 1 056 × 488; 1,44 MiB
.png)
.png)


_-_2022_-_World_Bank.png)


.svg)
.svg)
_Produto_interno_bruto_nominal_do_Brasil.png)
_D%C3%ADvida_p%C3%BAblica_geral_do_Brasil.png)
_Produto_interno_bruto_nominal_do_Brasil.png)
_Produto_interno_bruto_real_do_Brasil.png)
.png)
.png)
.png)
.png)
.png)
.png)
.png)
.png)
.png)
.png)
.png)