Category:Economy of Norway
Aller à la navigation
Aller à la recherche
economy of the country  | |||||
| Téléverser des médias | |||||
| Nature de l’élément | |||||
|---|---|---|---|---|---|
| Sous-classe de | |||||
| Monnaie |
| ||||
| PIB (PPA) par habitant |
| ||||
| Produit intérieur brut à parité de pouvoir d'achat |
| ||||
| Produit intérieur brut nominal |
| ||||
| PIB par habitant |
| ||||
| Taux de croissance |
| ||||
| Taux d'inflation |
| ||||
| Réserves totales |
| ||||
| Taxe sur la valeur ajoutée |
| ||||
| Lieu | Norvège | ||||
| |||||
Sous-catégories
Cette catégorie comprend 45 sous-catégories, dont les 45 ci-dessous.
*
A
- Arctic Economic Council (5 F)
C
D
E
F
- Freight trains in Narvik (9 F)
H
I
L
M
N
O
P
R
S
- Social security in Norway (10 F)
T
W
Média dans la catégorie « Economy of Norway »
Cette catégorie comprend 38 fichiers, dont les 38 ci-dessous.
-
 081121gangen lonnsoppgjoer.png 1 512 × 720 ; 71 kio
-
 2006Norwegian exports.PNG 1 425 × 625 ; 59 kio
-

-
-

-

-
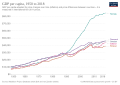
 Balanza comercial de Noruega del periodo 2010-2014.png 758 × 480 ; 10 kio
-
 Bedriftspresentasjon teknologiporten.jpg 3 872 × 2 592 ; 10,01 Mio
-
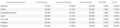
 Bruttoårsinntekt Innlandet 2020-2022.svg 1 261 × 1 364 ; 169 kio
-
 Budget balance of Norway in relation to GDP (2017-2027) (hy).png 908 × 611 ; 65 kio
-
 Capital formation Norway 1865 2003.PNG 838 × 525 ; 20 kio
-
 Exports and imports as pc of GDP 1865 2003.PNG 736 × 525 ; 20 kio
-
 Exports of Norway in 2017.svg 1 610 × 915 ; 424 kio
-
 Fogderegnskapene i Riksarkivet fyller nesten 5000 esker.jpg 3 888 × 2 592 ; 3,36 Mio
-
 Forordningen av 21.02.1711..jpg 979 × 1 316 ; 310 kio
-
 Framdrift tariffoppgjør i norge.png 1 512 × 720 ; 72 kio
-
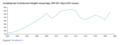 GDP of Norway (2000-2021) (billion USD) (hy).png 1 119 × 424 ; 60 kio
-
 GDP per capita development in Northern Europa.svg 850 × 600 ; 61 kio
-
 GulBok.JPG 278 × 392 ; 9 kio
-
 Handlingsregelen.png 424 × 509 ; 18 kio
-
 HNoMS Nordkapp (1937).jpg 370 × 224 ; 13 kio
-
 Importaciones de Noruega del periodo noviembre 2014-abril 2015.png 758 × 480 ; 42 kio
-
-
-
 Nordic Edge Expo.jpg 3 875 × 2 579 ; 2,31 Mio
-
 Norsk kulbrinteproduktion 1970-2020.png 980 × 450 ; 28 kio
-
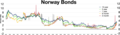 Norway bonds.webp 5 427 × 1 582 ; 342 kio
-
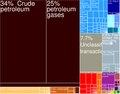 Norway Exports Tree Map (2009).pdf 1 333 × 1 041 ; 7 kio
-
 Norway Exports Tree Map (2009).svg 853 × 667 ; 30 kio
-
 Norway Grants.JPG 1 600 × 1 063 ; 804 kio
-
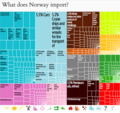 Norway Imports.png 922 × 870 ; 219 kio
-
 Norway Oil Fund.png 721 × 433 ; 24 kio
-
 Norwegianeconomy.png 1 692 × 1 516 ; 4,57 Mio
-
 Public vs private consumption Norway.PNG 853 × 525 ; 18 kio
-
 Share of economic sectors in the GDP of Norway (2011-2021) (hy).png 1 095 × 671 ; 58 kio
-
 Statsgjeld 1965 2009.gif 573 × 445 ; 8 kio
-
 Terra-skandalen.SVG 645 × 694 ; 519 kio
-
 Utgiftene.JPG 580 × 390 ; 65 kio


_(hy).png)


.jpg)

.jpg)
.jpg)


.svg)


_(hy).png)


_(billion_USD)_(hy).png)