Category:Genes
Salti al navigilo
Salti al serĉilo
baza fizika kaj funkcia unuo de heredaĵo, konsistanta el sekvenco de bazoparoj de deoksiribonuklea acido (DNA) aŭ de ribonuklea acido (RNA) (en iuj virusoj)  | |||||
| Alŝuti plurmedion | |||||
| Sondosiero de laŭtparoligita teksto | |||||
|---|---|---|---|---|---|
| Subaro de |
| ||||
| Parto de | |||||
| Alia ol | |||||
| |||||
Subkategorioj
Ĉi tiu kategorio havas la 21 jenajn subkategoriojn, el 21 entute.
A
- Artificial gene fusion (5 D)
C
- Candidate gene (11 D)
- CD48 antigen (7 D)
- Chromosome mapping (30 D)
G
- GAP-43 protein (7 D)
- Gene classes (12 D)
- Gene discovery (10 D)
- Gene dosage (14 D)
- Gene duplication (32 D)
- Gene library (11 D)
N
- Number of genes (11 D)
P
S
- Selfish gene (6 D)
T
- Thioredoxin reductase 1 (5 D)
- TNF-alpha-converting enzyme (7 D)
Dosieroj en kategorio “Genes”
La jenaj 200 dosieroj estas en ĉi tiu kategorio, el 275 entute.
(antaŭa paĝo) (sekva paĝo)-
 16S PCR DGGE.jpg 499 × 273; 27 KB
-
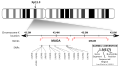
 2q37.3.png 1 024 × 197; 24 KB
-
 3decision 3D Viewer.svg 512 × 318; 928 KB
-
 4XHT asyr r 250.jpg 250 × 250; 20 KB
-
 50 50 chance.jpg 541 × 346; 29 KB
-
 A1BGgeneneighb.fcgi.png 485 × 75; 1 007 bajtoj
-
 A1BGprod.fcgi.png 540 × 68; 1 KB
-
 AAMDC.png 2 100 × 2 100; 1,8 MB
-
 ABCC11 genmap 01.svg 892 × 542; 80 KB
-
 Adenylylated Unadenylylated GS.PNG 457 × 478; 26 KB
-
 AIMP2.png 2 800 × 2 800; 6,04 MB
-
 Alleles on gene-es.png 433 × 401; 155 KB
-
 Alleles on gene.jpg 647 × 600; 71 KB
-
 Alteracions descrites al gen NR3C1.jpg 800 × 600; 36 KB
-
 AMY1cDNA.png 651 × 640; 57 KB
-
 Annotated Conceptual Translation of C19orf18.png 808 × 545; 115 KB
-
 Another KIAA0090 Conceptual Translation.jpg 741 × 810; 137 KB
-
 Antigenic Drift of the Flu Virus (5102830852).jpg 500 × 777; 194 KB
-
 APTX .png 2 100 × 2 100; 1,87 MB
-
 Arabinose operon chemical reactions.svg 1 594 × 338; 113 KB
-
 ATM 00000.png 2 100 × 2 100; 4,18 MB
-
 ATR .png 2 800 × 2 100; 4,62 MB
-
 Bcr-abl fusion gene.jpg 399 × 248; 16 KB
-
 BIOI Protein Representation.png 794 × 386; 81 KB
-
 Bloom syndrome protein.png 2 100 × 2 100; 793 KB
-
 BMP4 Signal Transduction Pathways.gif 720 × 540; 28 KB
-
 BotrydialGeneCluster.png 699 × 97; 27 KB
-
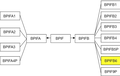
 BPIFfamily-BPIF-A1.png 952 × 599; 73 KB
-
 BPIFfamily-BPIF-A2.png 952 × 599; 74 KB
-
 BPIFfamily-BPIF-A3.png 952 × 599; 74 KB
-
 BPIFfamily-BPIF-A4P.png 952 × 599; 73 KB
-
 BPIFfamily-BPIFB1.png 952 × 599; 75 KB
-
 BPIFfamily-BPIFB2.png 952 × 599; 75 KB
-
 BPIFfamily-BPIFB3.png 952 × 599; 75 KB
-
 BPIFfamily-BPIFB4.png 952 × 599; 75 KB
-
 BPIFfamily-BPIFB5P.png 952 × 599; 75 KB
-
 BPIFfamily-BPIFB6.png 952 × 599; 74 KB
-
 BPIFfamily-BPIFB9P.png 952 × 599; 74 KB
-
 Brain Atlas.jpg 626 × 437; 49 KB
-
 BRCA Genes.svg 512 × 288; 48 KB
-
 BRCC3.png 2 500 × 2 100; 1,89 MB
-
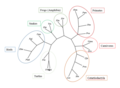
 C14 unrooted.png 2 004 × 1 547; 896 KB
-
 C1orf112 Location.png 1 062 × 214; 23 KB
-
 C1orf112Predicted3DStructure.png 984 × 750; 418 KB
-
 C20or202 transcription binding factor sites.png 1 122 × 1 238; 473 KB
-
 C20orf202 expression levels.png 2 392 × 538; 609 KB
-
 C20orf202 promoter.jpg 4 627 × 13 136; 9,13 MB
-
 C20orf202 structure.png 672 × 662; 105 KB
-
 C21orf62 Gene Evolution in Humans.png 928 × 524; 78 KB
-
 C2orf72 locus, 2q37.1.png 116 × 894; 20 KB
-
 C2orf72 Orthologs List.png 807 × 616; 305 KB
-
 C45 unrooted.png 1 503 × 1 002; 241 KB
-
 C4orf50 Gene Locus.png 1 602 × 202; 265 KB
-
 Cancer pharmacogenomics.png 1 206 × 804; 131 KB
-
 Caspase-motif-alignment.png 1 070 × 175; 27 KB
-
 CBlast 72-272 asparagines.png 326 × 452; 118 KB
-
 CCDC113 coiled-coil domain containing 113 - Homo sapiens (human).png 485 × 51; 867 bajtoj
-
 CCDC132 cartoon.png 818 × 82; 7 KB
-
 CCDC74A Diagram.png 1 296 × 200; 24 KB
-
 CDK1 .png 2 100 × 2 100; 2,93 MB
-
 CGDB CGDef.png 775 × 200; 30 KB
-
 CGDef 1.png 693 × 179; 28 KB
-
 Compact Gene Diagram of C2orf70.png 1 430 × 478; 81 KB
-
 Complete network.jpg 1 391 × 867; 98 KB
-
 Conceptual Translation 1.jpg 642 × 153; 20 KB
-
 Conceptual Translation of SMIM14 protein.png 1 616 × 1 102; 192 KB
-
 Conceptual Translation.jpg 683 × 847; 132 KB
-
 Conditional Knockout Mouse.jpg 427 × 277; 53 KB
-
 Cromosoma 5 amb senyalització al locus 5q31.3.png 1 094 × 140; 23 KB
-
 De-Gene.png 376 × 301; 49 KB
-
 DEPDC1B - Large-scale analysis of the mouse transcriptome.png 2 023 × 340; 24 KB
-
 DEPDC1B Conceptual Visualization.png 800 × 602; 12 KB
-
 DEPDC1B confirmed spice variants.png 1 067 × 142; 21 KB
-
 DEPDC1B Gene Locus - Chromosome 5.png 720 × 90; 1 KB
-
 Diagram of MEGF8 Splice Variants.png 1 119 × 403; 58 KB
-
-
 Dimer Mad1 Mad2.png 800 × 600; 222 KB
-
 DNA Diagram.png 336 × 192; 29 KB
-
 Domain carton.png 1 027 × 221; 56 KB
-
 DQ Illustration.PNG 274 × 203; 7 KB
-
 EFEMP2 protein.png 2 100 × 2 100; 1,97 MB
-
 EIF2AK2 protein.png 2 100 × 2 100; 1,04 MB
-

-
 ERCC6 protein.png 2 500 × 1 050; 1,26 MB
-
 EST Profiles.jpg 914 × 862; 151 KB
-
 Etv6 tm1a(KOMP)Wtsi.jpg 1 190 × 153; 95 KB
-
 Evolution fate duplicate genes - vector - cs.svg 576 × 360; 155 KB
-
 Evolution fate duplicate genes - vector.svg 576 × 360; 144 KB
-
 Evolution Graphh.png 1 204 × 677; 48 KB
-
 Evolution of Human GRAMD1B.jpg 844 × 557; 61 KB
-
 Evolution of Xist gene.tif 1 743 × 672; 107 KB
-
 Evolution of XIST-ru.tif 1 829 × 713; 3,76 MB
-
 Evolutionary History Graph.png 1 222 × 710; 40 KB
-
 Evolutionary History PRR30.png 1 155 × 759; 89 KB
-
 Evolutiongraph.png 897 × 522; 31 KB
-
 EvolutionOfDuplicateGenes.png 1 326 × 677; 28 KB
-
 Exon variants for POTEB.jpg 1 282 × 234; 40 KB
-
 Expression data.png 370 × 772; 10 KB
-
 F4.large.jpg 1 280 × 756; 82 KB
-
 FAM71E2 gene.png 1 488 × 261; 41 KB
-
 FAM71E2 image.gif 485 × 51; 798 bajtoj
-
 Figure 3 (8143602909).png 806 × 631; 218 KB
-
 Figure 4 (6796062698).png 606 × 370; 267 KB
-
 Figure 7 (7558900506).png 888 × 817; 990 KB
-
 Figure1(Yao).gif 651 × 939; 21 KB
-
 Figure2(Yao).gif 666 × 298; 12 KB
-
 Figure3(Yao).gif 528 × 201; 7 KB
-
 FITM2 Protein Structure.png 908 × 590; 39 KB
-
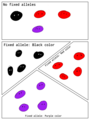 Fixed alleles illustration.png 768 × 1 024; 98 KB
-
 Flu Vaccine- Reassortment (5102830876).jpg 500 × 854; 369 KB
-
 Foco de adhesión esquema 2.jpg 7 874 × 6 687; 7,1 MB
-
 Future Developmental Structures of the Embryonic Telencephalon.svg 748 × 418; 230 KB
-
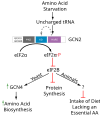 Gcn2 function.svg 1 481 × 1 772; 33 KB
-
 Gen CDK4.svg 1 000 × 130; 7 KB
-
 Gen IRAK4.jpeg 345 × 193; 13 KB
-
 Gen2.png 803 × 252; 8 KB
-
 Gen2.svg 741 × 229; 52 KB
-
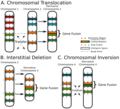 Gene Fusion Types.png 576 × 525; 86 KB
-
 Gene Intron Exon es.svg 677 × 565; 46 KB
-
 Gene Intron Exon nb.svg 677 × 565; 46 KB
-
 Gene name errors are widespread in the scientific literature.pdf 1 239 × 1 645, 3 paĝoj; 366 KB
-
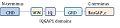
 Gene name normalization.jpg 600 × 737; 38 KB
-
 Gene neighborhood for C11orf54.png 519 × 101; 11 KB
-
 Gene Prediction.png 1 408 × 1 056; 64 KB
-
 Gene promoters according to T1D, IDM and T2D.png 2 205 × 1 469; 790 KB
-
 Gene structure (13080962024).jpg 842 × 318; 18 KB
-
 Gene structure de.svg 1 196 × 328; 12 KB
-
 Gene structure eukaryote 2 unannotated.svg 1 190 × 640; 106 KB
-
 Gene structure prokaryote 2 unannotated.svg 1 190 × 586; 99 KB
-
 Gene structure.gif 494 × 105; 4 KB
-
 Gene structure.svg 480 × 75; 11 KB
-
 Gene therapyB.jpg 142 × 142; 26 KB
-
 Gene time line draft.png 1 012 × 567; 46 KB
-
 Gene-ar.png 377 × 301; 54 KB
-
 Gene.png 376 × 301; 37 KB
-
 Gene2-plain-norsk.svg 1 395 × 1 182; 27 KB
-
 Genelocation2.png 722 × 92; 8 KB
-
 Genes and base pairs on chromosomes mk.svg 592 × 298; 184 KB
-
 Genes and base pairs on chromosomes.svg 592 × 298; 32 KB
-
 Genes and bases on chromosomes.png 762 × 270; 12 KB
-

-
 Genomic view of PRR29.png 720 × 90; 1 KB
-
 Glutamine synthetase II.jpg 1 128 × 475; 96 KB
-
 Glutamine synthetase.jpg 1 482 × 231; 151 KB
-
 GPS2 protein.png 1 050 × 2 500; 1,32 MB
-
 GRP .png 2 100 × 2 100; 736 KB
-
 Healthspan, parental lifespan, and longevity are highly genetically correlated.webp 1 998 × 1 269; 87 KB
-
 Hgh hpl.jpg 3 885 × 2 687; 2,52 MB
-
 High conservation.jpg 721 × 225; 89 KB
-
 HIPK2 .png 2 100 × 2 100; 2,31 MB
-
 HMGA1.png 2 100 × 2 100; 2,39 MB
-
 Hox gene expression in bones from tetrapod limbs.tif 1 335 × 760; 385 KB
-
 HSPA9.png 2 100 × 2 100; 1,86 MB
-
 HTR2C .png 2 600 × 1 462; 953 KB
-
 Human proteins - Conceptual translation of TMEM126B.png 450 × 503; 60 KB
-
Hy-Գեն (Gene).ogg 2 min 34 s; 5,17 MB
-
 ING1 .png 2 100 × 2 100; 2,43 MB
-
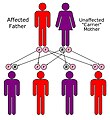 Inheritance 01.jpg 2 000 × 2 176; 394 KB
-
 Inheritance.jpg 2 000 × 2 176; 390 KB
-
 Interferon lambda genes.jpg 1 137 × 490; 56 KB
-
 Iodothyronine deiodinase.jpg 720 × 540; 43 KB
-
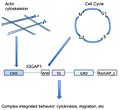 IQGAP1 pic2.jpg 432 × 397; 30 KB
-
 IQGAP1.jpg 486 × 112; 15 KB
-
 KIAA1551Tree.png 829 × 605; 69 KB
-
 Kiaa1797 DUF pic.PNG 804 × 60; 3 KB
-
 Kiaa1797 expression pic.PNG 729 × 292; 97 KB
-
 Kiaa1797 Gene hood.PNG 620 × 91; 53 KB
-
 Kit expression in hematopoietic cells.JPG 839 × 577; 42 KB
-
 L1CAM gene.png 630 × 118; 8 KB
-
 Lac complementation.png 926 × 800; 74 KB
-
 Lactase Processing.png 1 440 × 361; 55 KB
-
 Lasso-peptide-biosynthesis.png 1 651 × 2 229; 111 KB
-
 Liao, WW., Asri, M., Ebler, J. et al. (2023) Fig14.webp 2 125 × 819; 100 KB
-
 LIG1 gene showing important domains.gif 383 × 106; 4 KB
-
 Local seq alignment.JPG 901 × 190; 21 KB
-
 Location of C4orf54 on human chromosome 4.png 664 × 84; 27 KB
-
 LRRC23 RADAR Internal Repeats.png 553 × 291; 67 KB
-
 MAD1 function in SAC.jpg 759 × 297; 25 KB
-
 Mad2exchange.png 480 × 247; 65 KB
-
 Mad2figure.jpg 835 × 440; 68 KB
-
 MAOA Gene with ChrX Ideogram.svg 1 280 × 715; 42 KB
-
 MCC on.png 599 × 185; 42 KB
-
 Mdia1 domains.jpg 320 × 70; 23 KB
-
 Mhc geny.svg 680 × 280; 137 KB
-
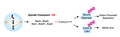
 Migración SDC4.jpg 879 × 520; 102 KB
-
 Mir-155 gene.pdf 1 650 × 1 275; 221 KB
-
 MLH1 for Wiki 12192018V7.png 1 151 × 1 022; 235 KB
-
 MLPA (completa).png 748 × 906; 53 KB
-
 MolecularEvolutionKIAA1551.jpg 849 × 473; 47 KB
-
 Mousehoxgenes.png 652 × 700; 45 KB
-
 MSX1.jpg 418 × 583; 80 KB
-
 Multiple sequence alignment.JPG 894 × 725; 170 KB
-
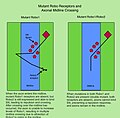 Mutant Robo Receptors and Axonal Midline Crossing.jpg 974 × 959; 256 KB
-
 MYBL2 in cell cycle.png 588 × 348; 17 KB
-
 Nasopharyngeal and oropharyngeal Swabs in VTM for SARS-CoV-2 Detection.jpg 4 000 × 2 250; 2,41 MB
-
 NBPF10 neighborhood.PNG 823 × 283; 32 KB
-
 Nrf2 Publications by Year.jpeg 537 × 379; 24 KB
-
 Oncogene.jpg 611 × 738; 135 KB
-
 Organisation génomique du virus HTLV.gif 450 × 317; 4 KB
-
 Ort of kiaa1797 pic.PNG 751 × 597; 59 KB


.jpg)


.png)
.png)
.png)
.gif)
.gif)


.jpg)


.jpg)


.png)


.png)
Wtsi.jpg)
.gif)
.jpg)
_Fig14.webp)