Category:Statistical charts
跳转到导航
跳转到搜索
| Category Statistical charts on sister projects: | |||||||||
|---|---|---|---|---|---|---|---|---|---|
English: Statistical charts.
Statistical charts are categorized:
- by created with: Hand drawn, software (like R, Mathematica, Gnuplot, ...)
- by language: Language-neutral, English, French, ...
- by type: Bar charts, Box plot, Pie charts, ...
维基媒体项目分类 | |||||
| 上传媒体 | |||||
| 隶属于 | |||||
|---|---|---|---|---|---|
| |||||
See also:
Resources:
子分类
本分类有以下43个子分类,共有43个子分类。
A
B
- Bag plots (1 F)
- Biplots (6 F)
- Box plots (142 F)
- Bubble charts (152 F)
C
- Chord diagrams (4 F)
- Correlograms (8 F)
D
E
F
- Frequency polygons (45 F)
- Funnel plots (15 F)
H
- Heat maps (70 F)
L
M
- Mosaic plots (2 F)
- Moving averages (35 F)
N
P
- Pareto charts (1 P, 48 F)
R
- Run charts (10 F)
S
T
- Temporal raster plot (1 F)
V
- Violin plots (6 F)
W
- Weibull graph paper (7 F)
分类“Statistical charts”中的媒体文件
以下200个文件属于本分类,共332个文件。
(上一页)(下一页)-
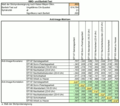
 1. Graph Gdp.jpg 499 × 500;24 KB
-
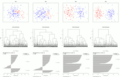
 3 composite model.svg 800 × 500;24 KB
-
 500-stat.jpg 933 × 591;92 KB
-
 A diagram of The Diverging C Curve.jpg 260 × 260;7 KB
-
 ACC nutrimouse after regularized process01.png 669 × 668;44 KB
-
 AcpClusterRL01.png 668 × 670;35 KB
-
 ADonaldBowling.png 1,175 × 606;16 KB
-
 AFM wine.png 959 × 489;97 KB
-
 Alleged Luka Magnotta Murder Video View Statistical Data.png 1,189 × 268;40 KB
-
 Anscombe-plot-1v.png 598 × 399;936 KB
-
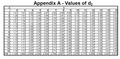 Appendix A.png 915 × 453;483 KB
-
 AsymmetricLaplace.jpg 699 × 434;130 KB
-
 AsymmetricLaplaceCDF.jpg 620 × 390;90 KB
-
 Belegdichte.svg 600 × 480;23 KB
-
 Biplot of Anderson's Iris data set.svg 540 × 540;84 KB
-
 Blue-tailed bee eaters seen in Sri Lanka, in percentage.png 528 × 328;18 KB
-
 Bonger-Table.jpg 775 × 598;179 KB
-
 Bounce Rate for Wikipedia Portal Dec 2015 - March 2016.png 1,289 × 781;148 KB
-
 Breast cancer probability according to mammography.svg 989 × 609;17 KB
-
 British proportional representation parliament.png 752 × 2,050;282 KB
-
 Bsp kaplan meier.jpg 733 × 550;85 KB
-
-
-
 Cara curve.png 645 × 385;12 KB
-
 Central Limit Theorem.png 1,024 × 768;122 KB
-
 Change in household composition in the US, 1960-2013.png 2,099 × 1,009;147 KB
-
 Chavenay.png 400 × 150;6 KB
-
 Chernof Flury Faces.JPG 500 × 500;50 KB
-

-
 Clickpath Analysis.png 1,228 × 789;110 KB
-
 Cohens d 4panel.svg 225 × 225;21 KB
-
 Collatz Statistic for all start values DE.svg 630 × 360;613 KB
-
 CollatzStatistic100million.png 1,921 × 964;11 KB
-
 Collider(statistics).png 251 × 252;7 KB
-
 Commons Growth.svg 800 × 600;35 KB
-
 Confounder mediator collider.svg 354 × 709;33 KB
-
 Contour plot della copula gaussiana.png 601 × 547;8 KB
-
 Contour plot della copula t di Student.png 601 × 502;6 KB
-
 Copula Gaussiana.png 838 × 746;25 KB
-
 Copula t di Student.png 838 × 746;22 KB
-
 Cumulative count distribution.jpg 1,638 × 1,152;404 KB
-
 Cumulative-hazard-JMedLife-04-210-g0012.jpg 697 × 496;80 KB
-
 CusumExample.svg 1,151 × 720;183 KB
-
 DG2015.jpg 1,280 × 720;143 KB
-
 Diagramm Entwicklung Challenge.jpg 3,088 × 1,378;736 KB
-
 DID definition.png 1,300 × 603;27 KB
-
 Dispersionfan+boxplot-en.pdf 1,112 × 354;9 KB
-
 Divorce statistics in Iran (1347-1385).svg 758 × 327;65 KB
-
 EdytaSzymańskaCoA.png 685 × 339;42 KB
-
 Effect of leverage on PER.png 831 × 586;26 KB
-
-
 Effectofselfrepairrus.png 800 × 489;47 KB
-
 EM Clustering of Old Faithful data.gif 360 × 309;113 KB
-
 Em old faithful.gif 360 × 360;272 KB
-
 EmpiricalQuantiles.svg 630 × 630;104 KB
-

-
 Esperanto-parolantoj Hungario 1940-2011.jpg 520 × 592;69 KB
-
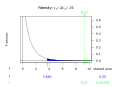 F-dens-2-15df.svg 800 × 578;65 KB
-
 Fab4187poppitstats.pdf 1,275 × 1,650;75 KB
-
 Fanchart-mathachieve-0912-en.gif 847 × 900;140 KB
-
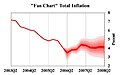 FanChartInfl.jpg 448 × 279;16 KB
-
 Figure1MA.png 510 × 312;66 KB
-
 Figure2MA.png 495 × 133;12 KB
-
 Figure3MA.png 495 × 135;14 KB
-
 Figure4MA.png 488 × 131;17 KB
-
 Figure5MA.png 489 × 129;11 KB
-
 FilmHype.jpg 602 × 427;33 KB
-
 Fisher meta.svg 360 × 288;169 KB
-
 Fisher transformation.svg 360 × 341;34 KB
-
 Fixed telephone lines per 100 inhabitants 1997-2007 ITU.png 956 × 810;26 KB
-
 Fmicb-07-02022-g005.jpg 1,000 × 666;121 KB
-
 Fstest.svg 450 × 360;25 KB
-
 Gauss-en kanpaia Banaketa normala.svg 704 × 246;34 KB
-
 GDP-Caribbean.png 800 × 473;97 KB
-
 Male-Female suicide ratios and rates 2015 (age-standardized).svg 512 × 327;3.76 MB
-
 Male-Female suicide ratios and rates 2015 (crude).svg 512 × 327;3.77 MB
-
 GHI2016-Map.jpg 1,073 × 754;114 KB
-
 Golden hour graph ru.png 695 × 413;74 KB
-
 Golden hour graph.png 695 × 413;51 KB
-
 Graphique charts britney spears.png 436 × 288;7 KB
-
 GTRNSJROCKPOP.png 838 × 584;35 KB
-
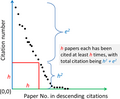 H index representation.png 718 × 594;33 KB
-
 Handelssysteem demo.png 560 × 403;17 KB
-
 Hazard functionJMedLife-04-210-g007.jpg 720 × 439;78 KB
-
 Health trend in China.jpg 485 × 444;53 KB
-
 Heinz-Nixdorf-Programm Teilnehmer nach Gastland.png 1,058 × 648;302 KB
-
 Heinz-Nixdorf-Programm Teilnehmer nach Geschlecht.png 1,066 × 642;234 KB
-
 Heures travaillees eurostat-FTvsPT.png 2,000 × 2,000;1.15 MB
-
 Heures travaillees OCDE.png 1,246 × 721;275 KB
-
 Historical Average ACT Scores.svg 512 × 341;87 KB
-
 Historical Average SAT Scores (Vector).svg 512 × 341;79 KB
-
 Historical Average SAT Scores.png 1,100 × 765;70 KB
-
 Hmwk3 chart.png 707 × 436;19 KB
-
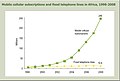 How mobile phones are overtaking landlines in Africa.jpg 557 × 378;83 KB
-
 ICC-example2.svg 720 × 540;52 KB
-
 Icecream.png 625 × 500;3 KB
-
 Idnes-cz-jizdni-rady.PNG 1,183 × 783;45 KB
-
 Income inequality in the United States, 1979-2007.png 11,400 × 15,300;325 KB
-
 Income inequality in the US.png 10,200 × 14,700;297 KB
-
 Income inequality, United States, 1979-2007.png 8,400 × 10,500;126 KB
-
 Indicators of School Crime and Safety 2013 Figure 11.3-ar.gif 780 × 371;13 KB
-
 Indicators of School Crime and Safety 2013 Figure 11.3.gif 780 × 371;16 KB
-
 Inverse transform sampling.png 382 × 378;23 KB
-
 IrisDAbiplot.jpg 1,151 × 395;47 KB
-
 ITS from uniform to exponential.png 698 × 464;6 KB
-
 J-shaped density.svg 629 × 629;19 KB
-
 Junejoetal ssm eccv08.jpg 1,501 × 419;210 KB
-
 KagiSample2Chart echarts.gif 448 × 180;5 KB
-
 KanColle user penetration 1st half.png 855 × 438;28 KB
-
 KanColle user penetration log.png 855 × 438;31 KB
-
 KanColle user penetration.png 855 × 438;35 KB
-
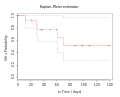 Kaplan-Meier-sample-plot.svg 521 × 419;31 KB
-
 Kaplan-Meyer Tabelle.jpg 803 × 321;92 KB
-
 Kernel alma simplified.png 322 × 115;56 KB
-
 Kernel ema simplified.png 323 × 115;5 KB
-
 Kernel hma simplified.png 322 × 115;5 KB
-
 Kernel sma simplified.png 323 × 115;5 KB
-
 Kreditdaten projiziert.svg 630 × 720;96 KB
-
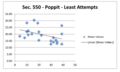 Least Attemps.png 529 × 319;16 KB
-

-
 Liu Bates (2013) Model of Attributional Style.png 561 × 676;61 KB
-
 Loess curve ru.svg 630 × 630;63 KB
-
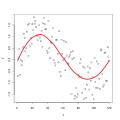 Loess curve.svg 630 × 630;49 KB
-
 Log-DiagnosticOddsRatio uk.svg 490 × 490;972 KB
-
 Log-DiagnosticOddsRatio.svg 490 × 490;972 KB
-
 Logarithmic Scales mk.svg 761 × 732;184 KB
-
 Logarithmic Scales no text.svg 748 × 702;56 KB
-
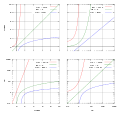 Logarithmic Scales.svg 761 × 732;60 KB
-
 LogLog exponentials.svg 512 × 512;12 KB
-
 Loglog x x2 x3.png 400 × 247;4 KB
-
 LSmoother width=1.png 1,200 × 900;14 KB
-
 Luftfrachtentwicklung 2004 2019 400.gif 1,248 × 588;39 KB
-
 LUSmoother width=1.png 1,200 × 900;11 KB
-
 Masern-Faelle USA.png 1,140 × 690;105 KB
-
 Masern-Fälle USA 1950-2001 retuschiert.png 1,389 × 791;37 KB
-
 Mass aids hs taxa acumulada.svg 630 × 630;82 KB
-
 MathematicaStatisticsImages.svg 500 × 500;5.31 MB
-
 MaximumLikelihood HolyTrinity.svg 630 × 630;26 KB
-
 MDS metric distances villes01.png 667 × 668;19 KB
-
 MDS nonmetric distances villes01.png 668 × 665;18 KB
-
 Measles incidence-cdc.gif 380 × 230;6 KB
-
 Media campionaria uscita stringa.png 640 × 480;31 KB
-
 Mediana geométrica.png 2,304 × 1,446;95 KB
-
 Mikrozensus2002AntiimageMsaKmo.png 666 × 586;20 KB
-
 MLB runspergame history.svg 640 × 480;10 KB
-
 Modelos ajustados a variograma.png 1,600 × 1,063;88 KB
-
 Mplwp probit.svg 600 × 400;32 KB
-
 Multiple binomial testing.svg 890 × 890;340 KB
-
 Neuss-Stadionviertel Einwohnerentwicklung.jpg 829 × 440;93 KB
-
 Nmds.png 480 × 480;3 KB
-

-
 Norm silhouette.png 1,600 × 1,024;37 KB
-
 Norwegian Storting Individual Party Polls A.png 900 × 600;21 KB
-
 Norwegian Storting Individual Party Polls Ap.png 900 × 600;21 KB
-
 Norwegian Storting Individual Party Polls Frp.png 900 × 600;22 KB
-
 Norwegian Storting Individual Party Polls full.png 900 × 600;54 KB
-
 Norwegian Storting Individual Party Polls H.png 900 × 600;21 KB
-
 Norwegian Storting Individual Party Polls KrF.png 900 × 600;22 KB
-
 Norwegian Storting Individual Party Polls MDG.png 900 × 600;19 KB
-
 Norwegian Storting Individual Party Polls R.png 900 × 600;21 KB
-
 Norwegian Storting Individual Party Polls Sp.png 900 × 600;19 KB
-
 Norwegian Storting Individual Party Polls SV.png 900 × 600;22 KB
-
 Norwegian Storting Individual Party Polls V.png 900 × 600;23 KB
-
 Norwegian Storting Monthly Party Polls.svg 800 × 600;445 KB
-
 Norwegian Storting Montly Party Polls, zoom.png 1,200 × 800;34 KB
-
 Norwegian Storting Montly Party Polls.png 1,200 × 800;32 KB
-
 Nuvem de variograma.png 2,100 × 1,167;324 KB
-
 NYW-confidence-interval.png 381 × 191;3 KB
-
 NYW-confidence-interval.svg 222 × 91;6 KB
-
 NZ Pound.jpg 1,579 × 561;150 KB
-
 Odds ratio map.svg 720 × 540;223 KB
-
 Odds ratio minsig.svg 720 × 540;41 KB
-
 Offline-reconstructor qtplot.png 1,250 × 573;48 KB
-
 Offline-reconstructor wt200.png 822 × 596;57 KB
-
 OneFactorFiveIndicators.jpg 246 × 195;14 KB
-
 OpenMx front page model.png 1,058 × 898;100 KB
-
 Optimal surface detection frank dove legal neighbours.svg 406 × 207;18 KB
-
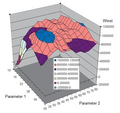 Optimalisatie 2 parameters.png 413 × 388;159 KB
-
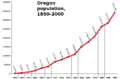 Oregon population 1850 2000.png 984 × 647;53 KB
-
 Oregon voter reg 1950-2006.png 982 × 614;55 KB
-
 Orikrin1998 dépendance.png 917 × 439;20 KB
-
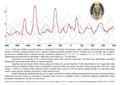 Pales Emil Graf Rytmus lability politické moci v Egypte cs.pdf 1,239 × 872;209 KB
-
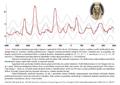 Pales Emil Graf Rytmus lability politické moci v Egypte.pdf 1,239 × 872;232 KB
-
 Pales Emil Graf Rytmus Samael Sutech Nergal cs.pdf 1,239 × 1,752;146 KB
-
 Pales Emil Graf Rytmus Samael Sutech Nergal.pdf 1,239 × 1,752;145 KB
-
 ParallelCoordinatePattern.svg 900 × 360;116 KB
-
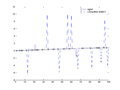
 PartielleAutokorrelation.png 480 × 480;5 KB
-
 Paul charts 2003.gif 480 × 244;4 KB
-
 Percentile interpolation.png 2,400 × 1,600;198 KB
-
 Percentile rank 10-score example histogram.png 372 × 255;6 KB
-
 Percentile.png 2,400 × 1,600;81 KB
-

-
-
 Picviz-0.1.png 1,047 × 777;91 KB
-
 Pink 4.JPG 282 × 280;13 KB
-
 Plotbitrate Big Buck Bunny graph with frame types.png 3,000 × 1,200;228 KB
-
 Plotbitrate Big Buck Bunny graph.png 3,000 × 1,200;173 KB
-
 Plots from lm example.png 1,008 × 1,008;69 KB
-
 PLS algorithm01.png 618 × 442;17 KB
-


.png)


.svg)


.svg)
.svg)


.svg)


_Model_of_Attributional_Style.png)


