File:1 to minus 2.svg
Jump to navigation
Jump to search

Size of this PNG preview of this SVG file: 800 × 600 pixels. Other resolutions: 320 × 240 pixels | 640 × 480 pixels | 1,024 × 768 pixels | 1,280 × 960 pixels | 2,560 × 1,920 pixels | 1,300 × 975 pixels.
Original file (SVG file, nominally 1,300 × 975 pixels, file size: 13 KB)
Captions
Captions
Add a one-line explanation of what this file represents
Summary[edit]
| Description |
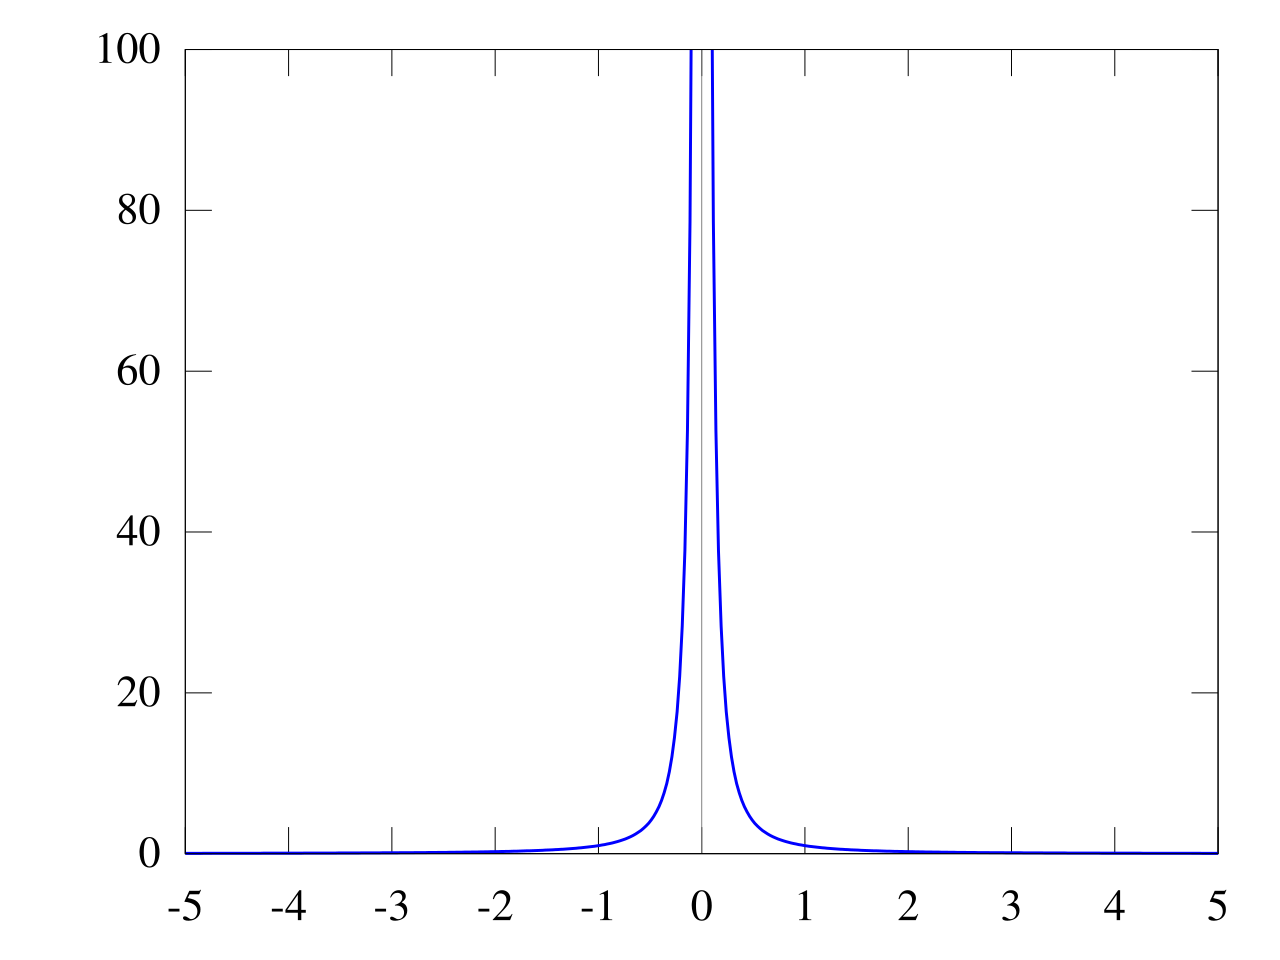
English: This SVG image is graph of function in neighbourhood of zero. In the image is shown that the function have a limit in zero and this limit is infinity.
Čeština: Tento SVG obrázek je graf funkce v okolí nuly. Na tomto obrázku je viditelné, že tato funkce má v nule nevlastní limitu (nekonečno). |
||
| Date | |||
| Source | Own work | ||
| Author | Zagothal | ||
| SVG development | This plot uses embedded text that can be easily translated using a text editor. | ||
| Source code | Gnuplot code
|

Licensing[edit]
I, the copyright holder of this work, hereby publish it under the following licenses:
This file is licensed under the Creative Commons Attribution-Share Alike 3.0 Unported license.
- You are free:
- to share – to copy, distribute and transmit the work
- to remix – to adapt the work
- Under the following conditions:
- attribution – You must give appropriate credit, provide a link to the license, and indicate if changes were made. You may do so in any reasonable manner, but not in any way that suggests the licensor endorses you or your use.
- share alike – If you remix, transform, or build upon the material, you must distribute your contributions under the same or compatible license as the original.

|
Permission is granted to copy, distribute and/or modify this document under the terms of the GNU Free Documentation License, Version 1.2 or any later version published by the Free Software Foundation; with no Invariant Sections, no Front-Cover Texts, and no Back-Cover Texts. A copy of the license is included in the section entitled GNU Free Documentation License. |
You may select the license of your choice.
File history
Click on a date/time to view the file as it appeared at that time.
| Date/Time | Thumbnail | Dimensions | User | Comment | |
|---|---|---|---|---|---|
| current | 09:36, 28 September 2014 | | 1,300 × 975 (13 KB) | Wereldburger758 (talk | contribs) | Valid SVG now. |
| 22:17, 9 October 2010 |  | 1,300 × 975 (12 KB) | Zagothal (talk | contribs) | {{Information |Description={{en|1=This SVG image is graph of function <math>\scriptstyle f(x)=\frac{1}{x^2}</math> in neighbourhood of zero. In the image is shown that the function have a limit in zero and this limit is infinity.}} {{cs|1=Tento SVG obráz |
You cannot overwrite this file.
File usage on Commons
There are no pages that use this file.
File usage on other wikis
The following other wikis use this file:
- Usage on cs.wikipedia.org