File:Colorful Science Sheds Light on Solar Heating - Flickr - NASA Goddard Photo and Video.jpg
Original file (711 × 727 pixels, file size: 727 KB, MIME type: image/jpeg)
Captions
Captions
Summary[edit]
| Description |
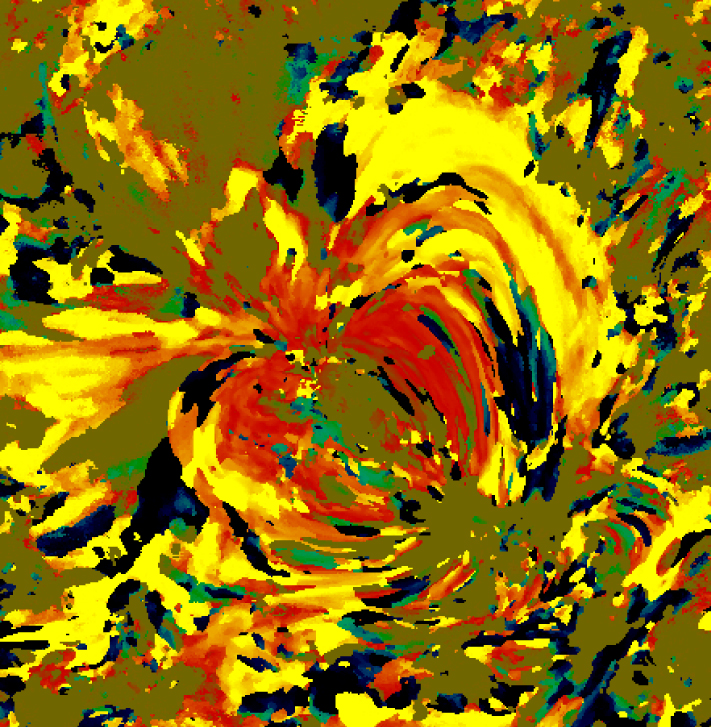
This visualization uses specific colors to describe which areas on the sun cooled or heated over a 12-hour period. The use of reds and yellows imply that higher temperatures dominated earlier in the time period, while lower temperatures dominated later, meaning that the area showed steady cooling over time, but any heating happened too quickly and impulsively to be measured. The image compares wavelength 211 (which shows material in the 2 million K range) to wavelength 171 (which shows material about ten times cooler). Credit: NASA/Viall To read more go to: www.nasa.gov/mission_pages/sunearth/news/colorful-science... NASA Goddard Space Flight Center enables NASA’s mission through four scientific endeavors: Earth Science, Heliophysics, Solar System Exploration, and Astrophysics. Goddard plays a leading role in NASA’s accomplishments by contributing compelling scientific knowledge to advance the Agency’s mission. Follow us on Twitter Like us on Facebook Find us on Instagram |
| Date | |
| Source | Colorful Science Sheds Light on Solar Heating |
| Author | NASA Goddard Space Flight Center from Greenbelt, MD, USA |
Licensing[edit]
- You are free:
- to share – to copy, distribute and transmit the work
- to remix – to adapt the work
- Under the following conditions:
- attribution – You must give appropriate credit, provide a link to the license, and indicate if changes were made. You may do so in any reasonable manner, but not in any way that suggests the licensor endorses you or your use.
| This image was originally posted to Flickr by NASA Goddard Photo and Video at https://www.flickr.com/photos/24662369@N07/7603770712. It was reviewed on 17 August 2012 by FlickreviewR and was confirmed to be licensed under the terms of the cc-by-2.0. |
| This file is in the public domain in the United States because it was solely created by NASA. NASA copyright policy states that "NASA material is not protected by copyright unless noted". (See Template:PD-USGov, NASA copyright policy page or JPL Image Use Policy.) | ||
 |
Warnings:
|
File history
Click on a date/time to view the file as it appeared at that time.
| Date/Time | Thumbnail | Dimensions | User | Comment | |
|---|---|---|---|---|---|
| current | 20:31, 17 August 2012 | | 711 × 727 (727 KB) | Werieth (talk | contribs) | == {{int:filedesc}} == {{Information |Description=This visualization uses specific colors to describe which areas on the sun cooled or heated over a 12-hour period. The use of reds and yellows imply that higher temperatures dominated earlier in the tim... |
You cannot overwrite this file.
File usage on Commons
There are no pages that use this file.