File:FM Modulated Signal.svg
Jump to navigation
Jump to search

Size of this PNG preview of this SVG file: 600 × 260 pixels. Other resolutions: 320 × 139 pixels | 640 × 277 pixels | 1,024 × 444 pixels | 1,280 × 555 pixels | 2,560 × 1,109 pixels.
Original file (SVG file, nominally 600 × 260 pixels, file size: 51 KB)
Captions
Captions
Add a one-line explanation of what this file represents
| Description |
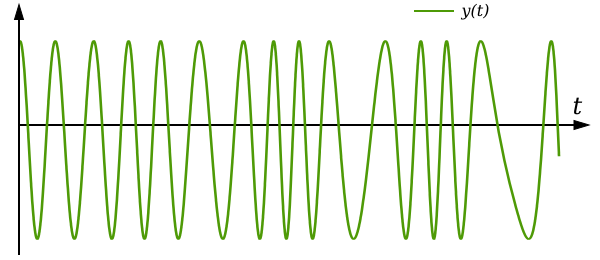
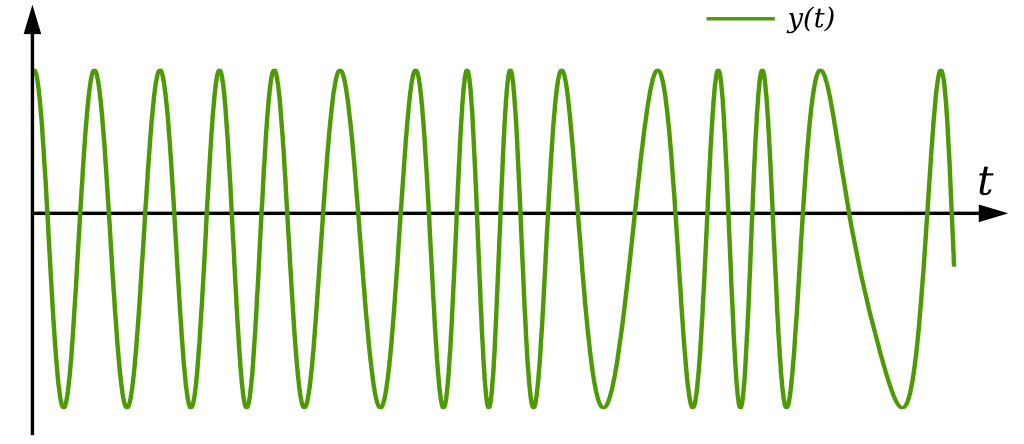
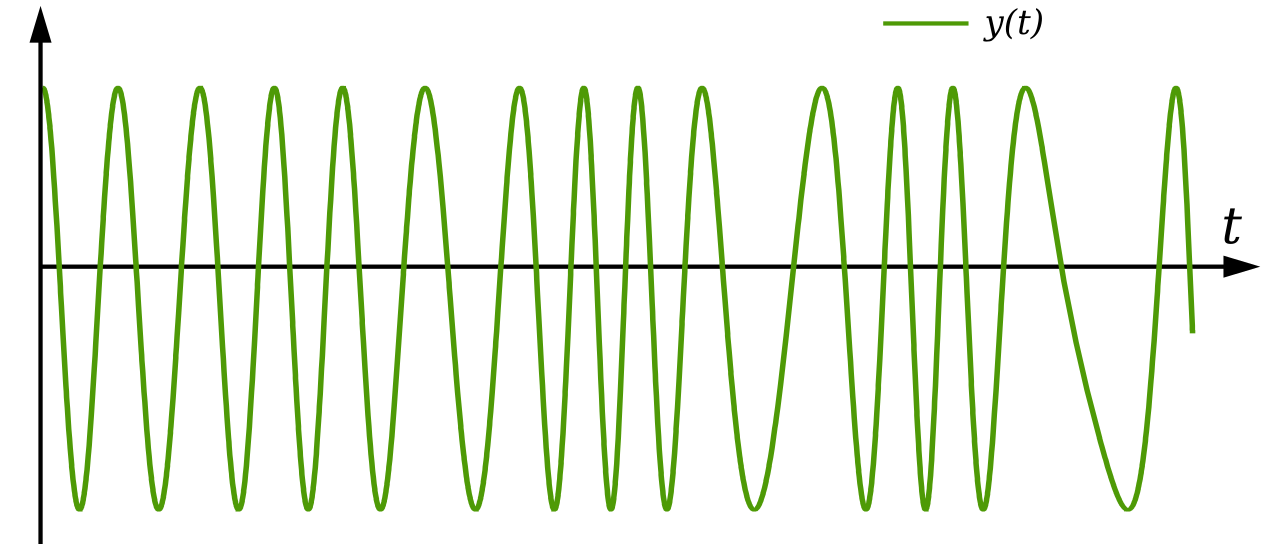
A graph showing an FM modulated signal. The modulating (message) and carrier signals are given respectively as: where The modulated signal is then given by: where the frequency deviation is given by: |
||
| Date | |||
| Source | self-made in Inkscape | ||
| Author | Inductiveload | ||
| Permission (Reusing this file) |
|
||
| Other versions | Modulating and Carrier Signals |
![{\displaystyle x_{m}(t)=0.65\left[0.2\sin(t)+0.5\cos(2t)+\cos(4.5t)\right]}](https://wikimedia.org/api/rest_v1/media/math/render/svg/29e48b131d5bcd94a9f3a312108f833adfdf755a)


![{\displaystyle y(t)A\cos \left(2\pi \int _{0}^{t}\left[f_{c}+x_{m}(\tau )f_{\Delta }\right]\,d\tau \right)}](https://wikimedia.org/api/rest_v1/media/math/render/svg/d790573395543ee98d90a6de7e8dfd7a7efdbbea)

File history
Click on a date/time to view the file as it appeared at that time.
| Date/Time | Thumbnail | Dimensions | User | Comment | |
|---|---|---|---|---|---|
| current | 12:41, 16 February 2008 | | 600 × 260 (51 KB) | Inductiveload (talk | contribs) | {{Information |Description=A graph showing an FM modulated signal. The modulating (message) and carrier signals are given respectively as: *<math>x_m(t)=0.2 \sin(t) + 0.5 \cos(2 t) + \cos(4.5 t); *<math>x_c(t)=A \cos(2 \pi f_c); where *<math>A=2\,</math> |
You cannot overwrite this file.
File usage on Commons
The following 2 pages use this file:
File usage on other wikis
The following other wikis use this file:
- Usage on da.wikipedia.org
- Usage on fr.wikibooks.org
- Usage on www.wikidata.org