File:History of Bitcoin difficulty.svg

Original file (SVG file, nominally 567 × 319 pixels, file size: 25 KB)
Captions
Captions
Summary[edit]
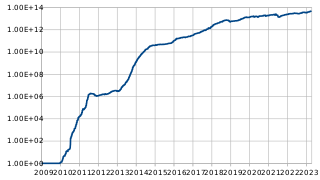
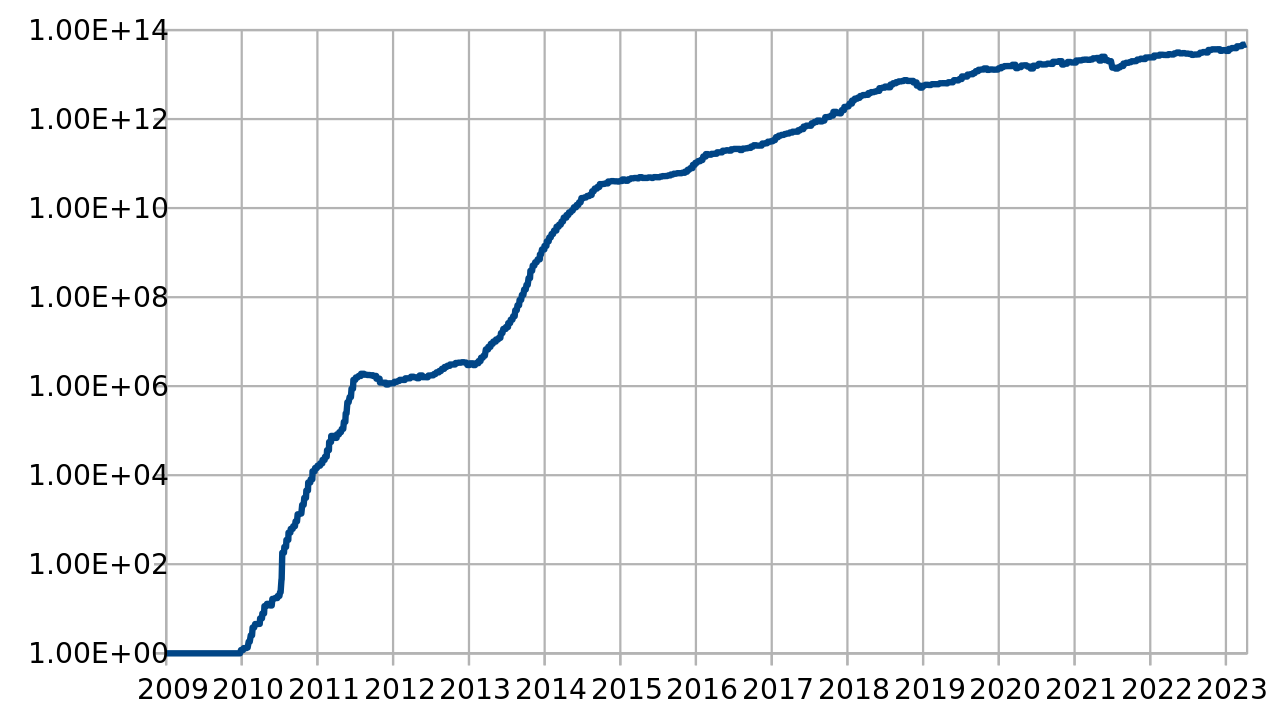
| Description |
English: Bitcoin relative mining difficulty chart with logarithmic vertical scale. Relative difficulty defined as 1 at 9 January 2009. Higher number means higher difficulty. Horizontal range is from 9 January 2009 to 8 November 2014. |
| Date | 16 November 2014 (original upload date) |
| Source | Own work |
| Author | Ladislav (talk) (Uploads) |
| Other versions |
 |
Newer versions of this file with a different license can be found here: 
Licensing[edit]
| Copyright © The author
Redistribution and use in source and binary forms, with or without modification, are permitted provided that the following conditions are met:
This software is provided by The author and contributors "as is" and any express or implied warranties, including, but not limited to, the implied warranties of merchantability and fitness for a particular purpose are disclaimed. In no event shall The author and contributors be liable for any direct, indirect, incidental, special, exemplary, or consequential damages (including, but not limited to, procurement of substitute goods or services; loss of use, data, or profits; or business interruption) however caused and on any theory of liability, whether in contract, strict liability, or tort (including negligence or otherwise) arising in any way out of the use of this software, even if advised of the possibility of such damage.
|
Original upload log[edit]
| Date/Time | Dimensions | User | Comment |
|---|---|---|---|
| 2016-01-11 13:58 | 567×319× (19601 bytes) | Ladislav Mecir | End date: 2016-09-01 |
| 2015-01-03 20:46 | 567×319× (18780 bytes) | Ladislav Mecir | end date: 2014-12-31 |
| 2014-11-24 20:20 | 567×319× (18684 bytes) | Ladislav Mecir | Display just the year on the date scale |
| 2014-11-22 18:40 | 567×319× (18397 bytes) | Ladislav Mecir | try yearly interval for date axis |
| 2014-11-22 18:38 | 567×319× (18565 bytes) | Ladislav Mecir | try yearly interval for dates |
| 2014-11-22 18:36 | 567×319× (18565 bytes) | Ladislav Mecir | Try yearly ticks for date axis |
| 2014-11-16 14:03 | 567×319× (16990 bytes) | Ladislav Mecir | Delete the title |
| 2014-11-16 12:52 | 567×319× (17124 bytes) | Ladislav Mecir | Libre Office Calc chart, smaller font |
| 2014-11-16 09:30 | 1052×744× (41676 bytes) | Ladislav Mecir | use LibreOffice to export the chart, the chart exported from OpenOffice was distorted |
| 2014-11-16 08:51 | 1052×744× (41676 bytes) | Ladislav Mecir | Ladislav Mecir, data from Blockchain.info |
File history
Click on a date/time to view the file as it appeared at that time.
| Date/Time | Thumbnail | Dimensions | User | Comment | |
|---|---|---|---|---|---|
| current | 17:52, 16 April 2023 | | 567 × 319 (25 KB) | FrankAndProust (talk | contribs) | Added data up to 14 April 2023 |
| 20:49, 15 January 2023 |  | 567 × 319 (25 KB) | FrankAndProust (talk | contribs) | Added data up to 12 January 2023 | |
| 14:35, 23 October 2022 |  | 567 × 319 (25 KB) | FrankAndProust (talk | contribs) | Added data up to 21 October 2022 | |
| 21:48, 23 June 2022 |  | 567 × 319 (25 KB) | FrankAndProust (talk | contribs) | Added data up to 21 June 2022 | |
| 23:13, 12 February 2022 |  | 567 × 319 (25 KB) | FrankAndProust (talk | contribs) | Added data up to 10th February 2022 | |
| 16:44, 2 October 2021 |  | 606 × 319 (25 KB) | FrankAndProust (talk | contribs) | Added data up to 30 September 2021. Changed Y axis labels to powers of 10. | |
| 10:02, 1 November 2019 |  | 567 × 319 (22 KB) | Ladislav Mecir (talk | contribs) | Adjust maximum of the horizontal axis, add data up to 29 October 2019. | |
| 16:44, 15 October 2019 |  | 567 × 319 (22 KB) | Ladislav Mecir (talk | contribs) | Add data up to 1 October 2019 | |
| 23:24, 2 January 2017 |  | 567 × 319 (22 KB) | Ladislav Mecir (talk | contribs) | main grid update | |
| 18:06, 2 January 2017 |  | 567 × 319 (22 KB) | Ladislav Mecir (talk | contribs) | update upper bound for date |
You cannot overwrite this file.
File usage on Commons
The following 2 pages use this file:
File usage on other wikis
The following other wikis use this file:
- Usage on bn.wikipedia.org
- Usage on en.wikipedia.org