File:Linear least squares example2.svg
Jump to navigation
Jump to search

Size of this PNG preview of this SVG file: 279 × 274 pixels. Other resolutions: 244 × 240 pixels | 489 × 480 pixels | 782 × 768 pixels | 1,043 × 1,024 pixels | 2,085 × 2,048 pixels.
Original file (SVG file, nominally 279 × 274 pixels, file size: 50 KB)
Captions
Captions
Add a one-line explanation of what this file represents
Summary[edit]
| Description |
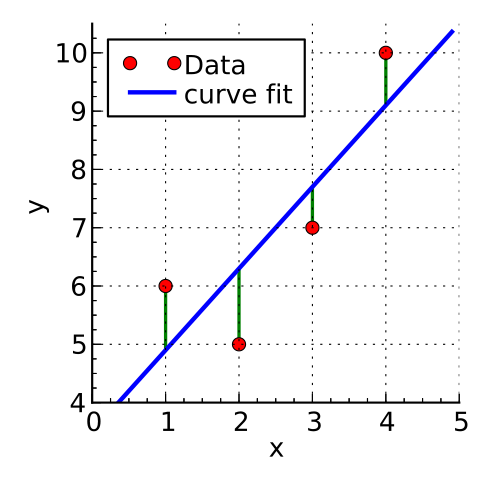
English: Illustration of least squares fitting. The data (red dots) are at co-ordinates (1,6), (2,5), (3,7) and (4,10). A linear approximation is obtained using least-squares estimation (blue line). Created using python. |
| Date | |
| Source | Own work |
| Author | Krishnavedala |
| Other versions |
File:Linear_least_squares_example2.png Derivative works of this file: |
W3C-validity not checked.
| Source Code |
|---|
from matplotlib.pyplot import *
from numpy import *
from mpl_toolkits.axisartist import *

x,y = [1.,2.,3.,4.], [6., 5., 7., 10.]
A = vstack([x, ones(len(x))]).T
b2,b1 = linalg.lstsq(A,y)[0]
x2 = arange(0,5,0.1)
y2 = lambda xx: b1+b2*xx

fig = figure(figsize=(3,3))
ax = Subplot(fig,"111",axisbg='none')
fig.add_subplot(ax)
ax.axis["right"].set_visible(False)
ax.axis["top"].set_visible(False)
ax.plot(x,y,'ro',label="Data")
ax.plot(x2,y2(x2),label="curve fit",lw=2)
ymin, ymax = [], []
for i in range(len(x)):
	yy = y2(x[i])
	if yy >= y[i]:
		ymin, ymax = append(ymin,y[i]), append(ymax,yy)
	else:
		ymin, ymax = append(ymax,yy), append(ymin,y[i])
ax.vlines(x,ymin, ymax,color='g',linestyles='solid',lw=1.5)
ax.set_ylabel("y",fontsize=12)
ax.set_xlabel("x",fontsize=12)
ax.grid(True)
ax.minorticks_on()
ax.set_xlim(0,5)
ax.set_ylim(4,10.5)
ax.legend(frameon=True, handletextpad=0,loc='upper left',\
	labelspacing=.05)
setp(ax.get_legend().get_texts(),fontsize=12)

fig.savefig("Linear_least_squares_example2.svg",bbox_inches="tight",\
	pad_inches=.15)
|
Licensing[edit]
I, the copyright holder of this work, hereby publish it under the following licenses:
This file is licensed under the Creative Commons Attribution-Share Alike 3.0 Unported license.
- You are free:
- to share – to copy, distribute and transmit the work
- to remix – to adapt the work
- Under the following conditions:
- attribution – You must give appropriate credit, provide a link to the license, and indicate if changes were made. You may do so in any reasonable manner, but not in any way that suggests the licensor endorses you or your use.
- share alike – If you remix, transform, or build upon the material, you must distribute your contributions under the same or compatible license as the original.

|
Permission is granted to copy, distribute and/or modify this document under the terms of the GNU Free Documentation License, Version 1.2 or any later version published by the Free Software Foundation; with no Invariant Sections, no Front-Cover Texts, and no Back-Cover Texts. A copy of the license is included in the section entitled GNU Free Documentation License. |
You may select the license of your choice.
File history
Click on a date/time to view the file as it appeared at that time.
| Date/Time | Thumbnail | Dimensions | User | Comment | |
|---|---|---|---|---|---|
| current | 03:35, 10 June 2011 | | 279 × 274 (50 KB) | Krishnavedala (talk | contribs) | {{Information |Description ={{en|1=Illustration of w:Linear_least_squares_(mathematicsleast squares fitting. The data (red dots) are at co-ordinates (1,6), (2,5), (3,7) and (4,10). A linear approximation is obtained using least-squares estimation |
You cannot overwrite this file.
File usage on Commons
The following 7 pages use this file:
- File:Linear least squares example2.png
- File:Regression lineaire abscisses.svg
- File:Regression lineaire abscisses ordonnees.svg
- File:Regression lineaire abscisses ordonnees orthogonal.svg
- File:Regression lineaire ordonnees.svg
- File:Regression lineaire ordonnees orthogonal.svg
- File:Regression lineaire orthogonal.svg
File usage on other wikis
The following other wikis use this file:
- Usage on ckb.wikipedia.org
- Usage on da.wikipedia.org
- Usage on de.wikibooks.org
- Mathematrix: AT BRP/ Theorie/ Reifeniveau 6
- Mathematrix: MA TER/ Theorie/ Statistik und Wahrscheinlichkeitsrechnung
- Mathematrix: AT BRP/ Theorie nach Thema/ Statistik und Wahrscheinlichkeitsrechnung
- Mathematrix: AT AHS/ Theorie nach Thema/ Statistik und Wahrscheinlichkeitsrechnung
- Mathematrix: BY GYM/ Theorie nach Thema/ Statistik und Wahrscheinlichkeitsrechnung
- Usage on en.wikipedia.org
- Usage on ro.wikipedia.org
- Usage on uk.wikipedia.org
- Usage on zh.wikipedia.org