File:Ogallala saturated thickness 1997-sattk97.svg
Jump to navigation
Jump to search

Size of this PNG preview of this SVG file: 516 × 599 pixels. Other resolutions: 207 × 240 pixels | 413 × 480 pixels | 661 × 768 pixels | 881 × 1,024 pixels | 1,763 × 2,048 pixels | 1,491 × 1,732 pixels.
Original file (SVG file, nominally 1,491 × 1,732 pixels, file size: 5.64 MB)
Captions
Captions
Add a one-line explanation of what this file represents
Summary[edit]
| Description |
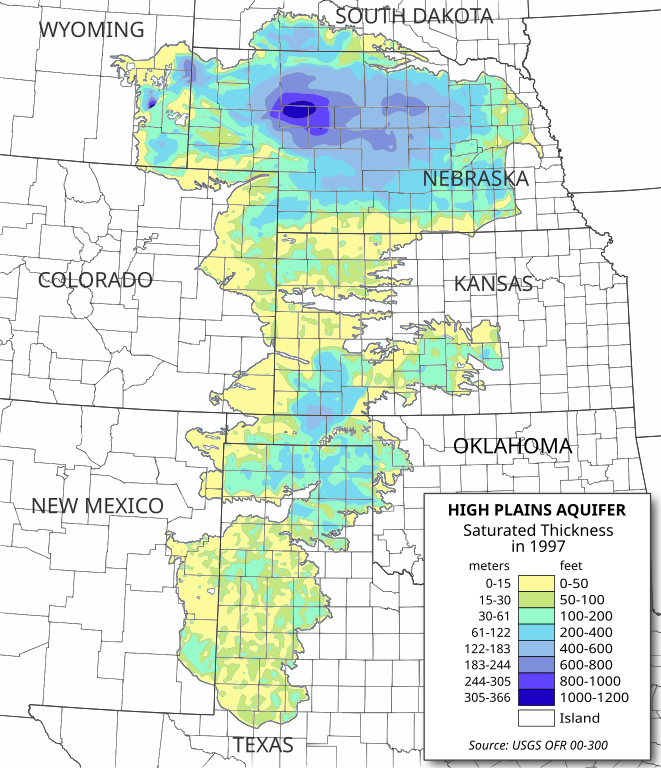
English: Digital map of the saturated thickness of the High Plains aquifer in parts of Kansas, Nebraska, New Mexico, Oklahoma, South Dakota, Texas and Wyoming, 1996-97.
Produced from GIS data produced by the USGS and published in Open File Report 00-300 (USGS OFR 00-300)[1]. Researchers: Fischer, Brian C.; Kollasch, Keith M.; McGuire, Virginia L. |
| Date | |
| Source | Own work |
| Author | Kbh3rd |
| Other versions |
 |
Licensing[edit]
I, the copyright holder of this work, hereby publish it under the following licenses:
This file is licensed under the Creative Commons Attribution-Share Alike 3.0 Unported license.
- You are free:
- to share – to copy, distribute and transmit the work
- to remix – to adapt the work
- Under the following conditions:
- attribution – You must give appropriate credit, provide a link to the license, and indicate if changes were made. You may do so in any reasonable manner, but not in any way that suggests the licensor endorses you or your use.
- share alike – If you remix, transform, or build upon the material, you must distribute your contributions under the same or compatible license as the original.

|
Permission is granted to copy, distribute and/or modify this document under the terms of the GNU Free Documentation License, Version 1.2 or any later version published by the Free Software Foundation; with no Invariant Sections, no Front-Cover Texts, and no Back-Cover Texts. A copy of the license is included in the section entitled GNU Free Documentation License. |
You may select the license of your choice.
File history
Click on a date/time to view the file as it appeared at that time.
| Date/Time | Thumbnail | Dimensions | User | Comment | |
|---|---|---|---|---|---|
| current | 03:14, 24 June 2009 | | 1,491 × 1,732 (5.64 MB) | Kbh3rd (talk | contribs) | Previous 2 version(s) may have had some sort of problem in the SVG/XML. This is recreated from scratch from my original bitmaps with the correct date and the adjusted colors. |
| 17:44, 23 June 2009 |  | 1,501 × 1,743 (2.01 MB) | Kbh3rd (talk | contribs) | Retrying upload; previous corrupted?? | |
| 17:39, 23 June 2009 |  | 1,501 × 1,743 (2.01 MB) | Kbh3rd (talk | contribs) | * Correct the date! * Change colors for more contrast between contours * Elliminate dark lines between contours | |
| 04:39, 22 June 2009 |  | 1,500 × 1,753 (6.16 MB) | Kbh3rd (talk | contribs) | {{Information |Description={{en|1=Digital map of the saturated thickness of the High Plains aquifer in parts of Kansas, Nebraska, New Mexico, Oklahoma, [[:en:Sout |
You cannot overwrite this file.
File usage on Commons
The following page uses this file:
File usage on other wikis
The following other wikis use this file:
- Usage on en.wikipedia.org