Category:2022 in science
Saltar para a navegação
Saltar para a pesquisa
Deutsch: 2022 in der Wissenschaft
English: 2022 in science
Español: Ciencia en 2022
Македонски: Науката во 2022 година
Русский: 2022 год в науке
Slovenščina: 2022 v znanosti
Svenska: Vetenskapsåret 2022
overview of the events of 2022 in science | |||||
| Carregar ficheiro | |||||
| Instância de |
| ||||
|---|---|---|---|---|---|
| Data de ocorrência |
| ||||
| Precedido por | |||||
| Sucedido por | |||||
| |||||
Subcategorias
Esta categoria contém as seguintes 28 subcategorias (de um total de 28).
*
- Economics studies of 2022 (9 F)
- 2022 in archaeology (6 F)
2
B
C
- Contemporary witchcraft beliefs (11 F)
I
- IPCC Sixth assessment report (49 F)
N
- Nadir crater and impact (5 F)
O
- OpenAlex (5 F)
R
T
W
Multimédia na categoria "2022 in science"
Esta categoria contém os seguintes 140 ficheiros (de um total de 140).
-
-

-
 20221231 Vital signs of the planet - NASA - climate change.png 3 121 × 231; 36 kB
-

-
-
-
 An AI learns basic physical principles.webp 1 033 × 472; 45 kB
-
 Ancient microorganisms in individual primary fluid inclusions in Browne Formation.png 1 268 × 1 342; 1,78 MB
-
-
 Annual mean temperature evolution in the Arctic.webp 1 000 × 1 017; 129 kB
-
 Applications of gravity cartography quantum sensing.webp 1 016 × 1 476; 177 kB
-
ARC-20221004-AAV3443-MoonOrigin-Social-NASAWeb-1080p medium.oggtheora.ogg 1 min 51 s, 640 × 360; 4,52 MB
-
 Average greenhouse gas emissions associated with different food products.png 1 636 × 1 005; 89 kB
-
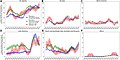
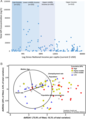
 Average yearly sentiment of headlines across 47 popular news media outlets.png 2 100 × 1 136; 566 kB
-

-
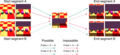
 Biometric and lifestyle analysis of LALs using cosine similarity scores.jpg 3 370 × 1 758; 594 kB
-
 Biophysical Effects on Global Temperature From Deforestation by 10° Latitude Band.jpg 4 223 × 3 795; 640 kB
-

-
 Cancer DALYs attributable to 11 Level 2 risk factors globally in 2019.jpg 5 047 × 3 200; 1 018 kB
-
 Cascading global climate failure.jpg 2 024 × 2 823; 740 kB
-

-
 Climatic impacts by year after different nuclear war soot injections.webp 1 889 × 1 938; 320 kB
-
-
 Combined potential emissions of all carbon bombs versus 1.5 °C carbon budget.jpg 1 500 × 1 446; 272 kB
-
 Comparison of Cas9-, D10A-, and H840A-induced repair phenotypes.jpg 3 334 × 4 259; 1,36 MB
-
 Comparison of comorbidities for bipolar affective disorder by age group.jpg 4 168 × 1 901; 1,03 MB
-
-

-
 CSCS Usage by Field Graph 23.png 500 × 390; 27 kB
-
 CSCS Usage by Institution Graph 23.png 523 × 417; 30 kB
-
-
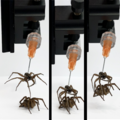
 Demonstration of functionality of the spider necrobotic gripper.webp 1 133 × 1 319; 290 kB
-
-

-
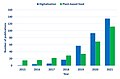
 Digitalisation in the vegetal supply chain.jpg 3 050 × 846; 342 kB
-
 Emerging signals of declining forest resilience under climate change.webp 940 × 1 687; 67 kB
-
 Emotionality in news articles headlines since 2000.png 2 100 × 2 367; 1 MB
-

-
-

-
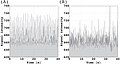
 Examples of electrical activity of fungi.jpg 1 573 × 2 743; 980 kB
-
-
-

-

-

-
-
 Food-, land-, and climate change mitigation-gaps for 2050.jpg 2 813 × 719; 329 kB
-
 Forest carbon loss across the tropics during 2001–2019.webp 1 617 × 574; 56 kB
-
 Fundamental behavioural ability with electronics in cyborg insects.webp 1 997 × 1 988; 218 kB
-
 Genes of reading- and language-related traits largely independent of performance IQ.jpg 2 918 × 2 865; 910 kB
-
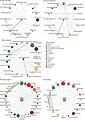
 Genetic correlation results about traits, IQ and language skills.jpg 2 920 × 3 875; 1,22 MB
-
 Genetic correlations of brain imaging traits and language skill-levels.jpg 2 024 × 662; 182 kB
-
 Germination and development of plants in lunar regolith.webp 1 839 × 2 495; 787 kB
-
 Global 100% RE System Analyses.gif 820 × 787; 102 kB
-
 Global average human diet and protein composition and usage of crop-based products.webp 2 117 × 1 598; 176 kB
-
 Global Carbon Budget Results - Fossil CO2 emissions charts.png 2 067 × 1 737; 186 kB
-
 Global deaths from cancers attributable to risk factors in 2019 by sex and SDI.jpg 4 159 × 2 881; 678 kB
-
-

-
 Global number of deaths (A) and YLLs (B), by pathogen and GBD super-region, 2019.jpg 4 161 × 2 255; 644 kB
-
 Global number of deaths (A) and YLLs (B), by pathogen and infectious syndrome, 2019.jpg 2 862 × 3 984; 1,38 MB
-
 Global number of deaths, by pathogen, age, and sex groups, 2019.jpg 5 050 × 5 331; 1,63 MB
-

-
 Images representing technical steps during sEmbryo culture protocol.jpg 3 206 × 4 151; 1,98 MB
-
-
-
-
 Laboratory robot Eve.jpg 477 × 316; 199 kB
-
 Land and freshwater footprints for protein production from various sources.jpg 1 433 × 857; 141 kB
-

-
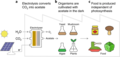
 Large-area organic solar cell module for cyborg insects.webp 1 961 × 923; 150 kB
-

-

-
 Mammal cloning publications over time and breed differences.webp 1 498 × 1 472; 130 kB
-
 Map of global forest loss and gain across decades from 1960 to 2019.jpg 1 725 × 1 247; 184 kB
-
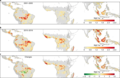
 Map of increasing heatwave trends over the midlatitudes and Europe.webp 1 999 × 953; 231 kB
-
 MatchMiner overview of data flow and modes of use.webp 1 311 × 1 042; 86 kB
-
 Meat production by region and production intensity in millions of tons.png 1 677 × 1 022; 106 kB
-

-

-
-

-

-
 Necrobotics concept.jpg 1 167 × 474; 167 kB
-
 Necrobotics with a spider.png 810 × 810; 459 kB
-

-

-
 Outdoor air pollution death rate, 1990 to 2019.svg 850 × 600; 35 kB
-
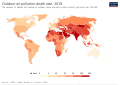 Outdoor air pollution death rate, 2019.svg 850 × 600; 163 kB
-

-
 Overlap between future population distribution and extreme heat.jpg 4 387 × 1 814; 1,97 MB
-

-

-

-
 Per capita annual meat consumption by region.png 1 299 × 776; 107 kB
-

-
 Perovskite photovoltaics efficiency chart 2022.png 2 562 × 2 312; 316 kB
-
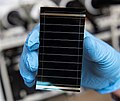 Perovskite solar cell.jpg 2 686 × 2 265; 1,87 MB
-
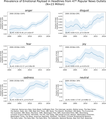
 Pharmaceutical pollution concentrations in the world's rivers.webp 3 552 × 5 358; 1,19 MB
-

-
 Pharmaceutical pollution of the world's rivers – sampling sites.webp 4 179 × 2 228; 436 kB
-
 Pharmaceutical pollution of the world's rivers – sites exceeding "safe" limits.webp 4 200 × 2 578; 704 kB
-

-
 Potential CO2 emissions from large fossil fuel projects 'carbon bombs' per country.jpg 3 149 × 2 173; 898 kB
-

-
 Rechargeable cyborg insects with an ultrasoft organic solar cell module.webp 2 000 × 1 713; 383 kB
-
 Recruitment and objective determination of look-alike human pairs.jpg 3 370 × 2 008; 1 013 kB
-
 Regional forest carbon loss and its drivers across the tropics during 2001–2019.webp 2 121 × 1 327; 191 kB
-

-

-

-

-

-

-

-
 Space mission to intercept or rendezvous with the next ‘Oumuamua.png 2 724 × 1 529; 4,14 MB
-
 Spatial pattern of forest carbon loss across the tropics.webp 1 827 × 1 186; 214 kB
-
-
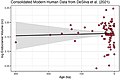
 Specimens of an analysis on human brain size over 9.8-million-years.jpg 829 × 468; 175 kB
-

-
 Study regions and sample pixel locations of a deforestation study.jpg 892 × 759; 159 kB
-
 Surface average atmospheric CO2 concentration (ppm) over time.png 2 067 × 1 316; 115 kB
-
 Temporal variations of forest resilience and its key drivers.webp 2 116 × 1 648; 302 kB
-
 The 2011–2022 decadal mean components of the global carbon budget.png 2 067 × 1 447; 547 kB
-
 The 43-year Arctic amplification ratio in observations and climate models.webp 2 000 × 604; 161 kB
-
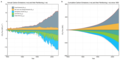
 The growth of all tracked objects in space over time (space debris and satellites).png 2 265 × 1 722; 478 kB
-
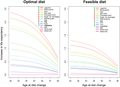
 The main drivers and challenges of plant-based diets.jpg 1 721 × 1 290; 379 kB
-

-
 Thin film perovskite solar cell and perovskite on silicon tandem solar cell.png 1 800 × 842; 127 kB
-
 Three possible ways a future supercontinent Amasia may assemble.jpg 2 008 × 945; 383 kB
-

-
 Total annual meat consumption by region.png 1 263 × 821; 81 kB
-
 Total annual meat consumption by type of meat.png 1 108 × 861; 82 kB
-
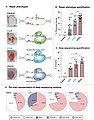
 Transcriptome analyses of plants grown in lunar regolith based on morphology.webp 1 347 × 1 731; 268 kB
-
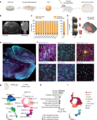 Transplantation of human cortical organoids in the developing rat cortex.webp 1 710 × 2 112; 592 kB
-
 Underground gravity quantum sensing.png 1 016 × 749; 712 kB
-

-
 Wireless and wearable aptamer-FET sensing system for on-body sweat analysis.jpg 4 320 × 2 787; 1,91 MB
-

.gif)


_from_the_map_and_from_the_reference_sample.jpg)


,_and_asthma_by_sex_(B).jpg)


_over_time_(1990%E2%80%932017).png)


.png)


.png)
.png)


_and_YLLs_(B),_by_pathogen_and_GBD_super-region,_2019.jpg)
_and_YLLs_(B),_by_pathogen_and_infectious_syndrome,_2019.jpg)


,_south_Asian_(B),_and_White_individuals_(C).jpg)


,_stratified_by_age,_sex,_and_ethnicity.jpg)


_and_for_the_highest_age-standardised_YLL_rate_per_100_000_population_(B),_for_each_country_or_territory,_2019.jpg)


.png)


_in_global_100%25_RE_scenarios_in_the_year_2050.gif)


_over_time.png)


.png)


.png)
_in_Year_2_after_different_nuclear_war_soot_injections.webp)