Category:Area charts
Jump to navigation
Jump to search
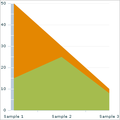
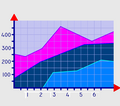
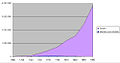
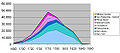
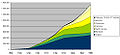
English: An area chart displays quantitative data graphically. It is based on the line chart. A line chart is a type of graph, created by connecting a series of data points together with a line. In an area chart the area between axis and line are commonly emphasized with colors, textures and hatchings.
type of chart  | |||||
| Upload media | |||||
| Subclass of | |||||
|---|---|---|---|---|---|
| |||||
See also:
Subcategories
This category has the following 3 subcategories, out of 3 total.
Media in category "Area charts"
The following 81 files are in this category, out of 81 total.
-
 Adobe Flex AreaChart.png 320 × 320; 7 KB
-
 AFTv5.Feedback applications.histogram.png 1,280 × 1,024; 29 KB
-
 Age of victimization chart.png 510 × 670; 99 KB
-
 Agregaty-m1-m2-m3.png 1,351 × 784; 60 KB
-
 Alan hesabi.gif 491 × 599; 26 KB
-
 Attribution du Prénom Paul.jpg 346 × 294; 30 KB
-
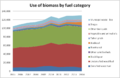 Biomass By Fuel Category, Sweden.png 981 × 635; 55 KB
-
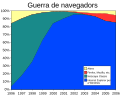 Browser Wars (ca).svg 614 × 497; 25 KB
-
 Browser Wars (en).png 640 × 480; 27 KB
-
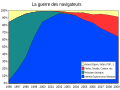 Browser Wars (fr).svg 640 × 480; 33 KB
-
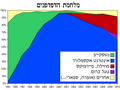 Browser Wars (he).png 640 × 480; 27 KB
-
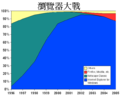 Browser Wars (zh).png 614 × 497; 28 KB
-
 Browser Wars (zh-cn).svg 640 × 480; 35 KB
-
 Browser Wars (zh-tw).svg 640 × 480; 35 KB
-
 Burnup.png 2,000 × 1,125; 56 KB
-
 Burnup2.png 2,000 × 1,125; 92 KB
-
 Energy Use by Source, Sweden.png 981 × 419; 50 KB
-
 Entwicklung CO2 EU02.png 1,027 × 1,077; 369 KB
-
 Federal timeline US prisoners.gif 686 × 459; 19 KB
-
 Figure 20 WISPI.jpg 624 × 433; 35 KB
-
 Graph rel share world manuf 1750 1900 01.png 568 × 347; 6 KB
-
 Graph rel share world manuf 1750 1900 02.png 527 × 299; 3 KB
-
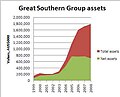 Great Southern Group assets 1999-2008.jpg 394 × 319; 11 KB
-
 Hadcm3-ann-ocean-t-180.png 799 × 787; 10 KB
-
 I2 Hill Dis.PNG 1,036 × 911; 46 KB
-
 LastGraph example.svg 413 × 388; 1.47 MB
-
 Lastprofil EWE Frühjahr mit Kraftwerkseinsatz schematisch.svg 900 × 720; 129 KB
-
 Lastprofil VDEW Winter mit Kraftwerkseinsatz schematisch.jpg 980 × 634; 188 KB
-
 Layout engine usage share-2009-01-07.svg 520 × 273; 36 KB
-
 MLB slugging history.svg 640 × 480; 25 KB
-
 NPVIC participants.svg 990 × 765; 264 KB
-
 Oil consumption per day by region from 1980 to 2006 no labels.svg 600 × 450; 98 KB
-
 Oil consumption per day by region from 1980 to 2006 original data.png 1,169 × 826; 27 KB
-
 Oil consumption per day by region from 1980 to 2006 solid2.svg 600 × 450; 134 KB
-
 Oil consumption per day by region from 1980 to 2006 solid3.svg 600 × 450; 136 KB
-
 Oil consumption per day by region from 1980 to 2006.pdf 1,239 × 1,752, 6 pages; 176 KB
-
 Oil consumption per day by region from 1980 to 2006.svg 600 × 450; 204 KB
-
 Operating systems used on top 500 supercomputers de.svg 1,200 × 720; 47 KB
-
 Operating systems used on top 500 supercomputers.svg 1,200 × 720; 47 KB
-
 Phdiscogs22Nov2014.jpg 1,499 × 748; 128 KB
-
 Processor families in TOP500 supercomputers.svg 1,232 × 873; 549 KB
-
 Rare-earths.gif 442 × 268; 14 KB
-
 Rareearth production-de.svg 834 × 496; 22 KB
-
 Rareearth production-fr.svg 447 × 268; 27 KB
-
 Rareearth production-ru.svg 450 × 268; 126 KB
-
 Rareearth production.svg 442 × 268; 18 KB
-
 Ratings share for Colombian TV channels 1998-2003.png 1,791 × 781; 37 KB
-
 Sampling Design.png 1,376 × 680; 39 KB
-
 San Francisco CA Population Growth.png 1,126 × 637; 52 KB
-
 San Francisco CA Population Growth.svg 1,126 × 637; 11 KB
-
 Screenshot area chart.png 1,754 × 856; 118 KB
-
 Sister project page views short.png 1,440 × 720; 51 KB
-
 Stacked area.png 917 × 611; 40 KB
-
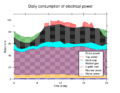 Tagesgang engl.png 792 × 612; 13 KB
-
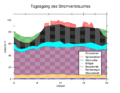 Tagesgang.png 792 × 612; 12 KB
-
 Task force page views short.png 1,440 × 720; 180 KB
-
 Uk tv viewing sharing 2001 - 2009.png 400 × 408; 21 KB
-
 Unreviewed patrol density.png 2,975 × 1,787; 68 KB
-
 Unreviwed editor density.png 2,975 × 1,787; 74 KB
-
 US and USSR nuclear stockpiles-IT.svg 555 × 405; 57 KB
-
 US and USSR nuclear stockpiles.png 880 × 662; 24 KB
-
 US Census Population Graph from 1790.svg 1,070 × 750; 6 KB
-
 US correctional population timeline.gif 691 × 471; 26 KB
-
 US incarceration timeline-clean-zh-hant.svg 730 × 520; 179 KB
-
 US incarceration timeline-clean.gif 694 × 486; 17 KB
-
 US incarceration timeline.gif 713 × 499; 22 KB
-
 US Slavery Statistics 1680 thru 1860 Deep South.jpg 1,000 × 457; 72 KB
-
 US Slavery Statistics 1680 thru 1860 Lower South.jpg 1,000 × 455; 71 KB
-
 US Slavery Statistics 1680 thru 1860 North South.jpg 1,000 × 527; 65 KB
-
 US Slavery Statistics 1680 thru 1860 North.jpg 1,000 × 444; 121 KB
-
 US Slavery Statistics 1680 thru 1860 South.jpg 1,000 × 502; 82 KB
-
 US Slavery Statistics 1680 thru 1860 Upper South.jpg 1,000 × 456; 96 KB
-
 USA Gallup abortion opinion poll stacked area.svg 731 × 551; 90 KB
-
 Use of Biomass per Sector.png 981 × 657; 46 KB
-
 Vg project page views short.png 1,440 × 720; 112 KB
-

-
 Vol cond dtf.png 3,946 × 2,071; 145 KB
-
 Wikisource - texts en April 2013.png 700 × 700; 55 KB
-
 Wpvg chart views per day project pages.png 1,440 × 720; 109 KB
-
 Wpvg chart views per day sister projects.png 1,440 × 720; 92 KB
-
 Wpvg chart views per day task forces.png 1,440 × 720; 175 KB


.svg)
.png)
.svg)
.png)
.png)
.svg)
.svg)


