Category:Income distribution
Saltar para a navegação
Saltar para a pesquisa
| Category Income distribution on sister projects: | |||||||||
|---|---|---|---|---|---|---|---|---|---|
English: Income distribution
manner in which a nation’s total GDP is distributed amongst its population | |||||
| Carregar ficheiro | |||||
| Instância de |
| ||||
|---|---|---|---|---|---|
| Subclasse de | |||||
| |||||
Subcategorias
Esta categoria contém as seguintes 17 subcategorias (de um total de 17).
C
- Circular flow of income (6 F)
D
F
G
- Generalized entropy index (72 F)
- Gross national income (1 P, 13 F)
I
L
M
- Median income and gender (2 F)
P
- Poverty rates (20 F)
Q
T
W
Multimédia na categoria "Income distribution"
Esta categoria contém os seguintes 103 ficheiros (de um total de 103).
-
 AdjustedWageShareUSAFRGJapan.PNG 978 × 632; 38 kB
-
 America Needs to Occupy Together.pdf 1 275 × 1 650; 290 kB
-
 Arbeitsentgelte.png 968 × 601; 33 kB
-
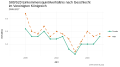
 Armutsgefährdungsquote in Frankreich, 2008-2017.svg 813 × 594; 139 kB
-
 Asignación Universal por Hijo.jpg 640 × 418; 57 kB
-
 At-risk-of-poverty rate ireland 1995-2016.svg 512 × 293; 12 kB
-
 Atkinson.pdf 1 239 × 1 754; 13 kB
-
 BerLohnquUSABRDJapan.PNG 978 × 632; 39 kB
-
 Change in Income 1980-2014.png 640 × 420; 14 kB
-
 Composition revenu ménage france.png 528 × 384; 20 kB
-
 Cumul allocation revenus.svg 464 × 391; 8 kB
-
 Cumulative change in real annual wages (1979-2012).png 1 005 × 619; 145 kB
-
 Cumulative change in real hourly wages of all workers (1979-2013).png 974 × 687; 166 kB
-
 Cumulative Growth in Income to 2016 from CBO.png 830 × 587; 163 kB
-
 Cumulative growth in real hourly wages (2007-2014).png 1 012 × 654; 131 kB
-

-

-
 Cumulative percent change in real hourly wages, by education, 2000-2018.png 1 033 × 724; 89 kB
-
 Cumulative percent change in real hourly wages, by wage group, 1979-2017.png 1 007 × 705; 81 kB
-

-
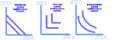
 Deadweight-loss-price-ceiling es.svg 350 × 350; 13 kB
-
 Deadweight-loss-price-ceiling.svg 350 × 350; 25 kB
-

-
 Dia festivo.jpg 621 × 359; 55 kB
-
 DIFFERENCE SALAIRES HOMME FEMME.jpg 521 × 285; 19 kB
-
 Distribución ingresos autónomos Chile 2006-2009.svg 750 × 400; 34 kB
-
 Effet redistribution.png 480 × 347; 14 kB
-
 EONIA Interbankensatz 2007.JPG 921 × 676; 73 kB
-
 EU-wide (Equivalised) Disposable Household Income Distribution, 2014.pdf 1 752 × 1 239; 147 kB
-
 Example of Flat Rate Loan Contract Chambak, Cambodia.JPG 1 361 × 1 077; 1,08 MB
-
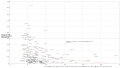 GDP per capita PPP vs 20 to 20 ratio 2016.svg 1 506 × 850; 82 kB
-
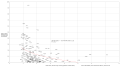 GDP per capita PPP vs Palma ratio 2016.svg 1 506 × 850; 82 kB
-
 GDP per capita, PPP (current international $) World bank, 2016.png 6 300 × 3 095; 1,62 MB
-
 Germany household income.svg 1 200 × 750; 12 kB
-
 HistofLeavebyCountry.png 580 × 383; 9 kB
-
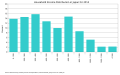
 Household income distribution in Japan-2009.svg 1 200 × 750; 14 kB
-
 Household income distribution in Japan.svg 1 200 × 750; 14 kB
-
 Income distribution in Japan by sex.svg 1 200 × 750; 22 kB
-
 Income inequality - share of income earned by top 1% 1975 to 2015.png 869 × 765; 256 kB
-
 Income percentiles ireland - relative change - 1995-2016.svg 512 × 293; 15 kB
-
 Income percentiles, with median and relative poverty levels marked.png 1 942 × 1 094; 75 kB
-
 Income Share of Top 10% in Croatia and the EU, 2010 - 2017.svg 512 × 256; 12 kB
-
 Individual Disposable Income (excl. NI).png 1 315 × 1 218; 556 kB
-
 Italy household income.svg 1 200 × 750; 12 kB
-
 Land Labour Graph.jpg 423 × 753; 64 kB
-
 Lilly Ledbetter DNC 2008.jpg 3 648 × 2 736; 3,9 MB
-
 Lohnquote Deutschland 1970 bis 2000.png 308 × 139; 4 kB
-
 LohnquoteBRD50plus.png 977 × 631; 55 kB
-
 LohnquUSAJBRD1.PNG 970 × 604; 46 kB
-
 LohnquUSAJBRD2.PNG 970 × 604; 41 kB
-
 Mean Median Income AT 1995-2017 EUSILC.svg 512 × 284; 25 kB
-
 Mean Median Income HU 2005-2018 EUSILC.svg 512 × 284; 18 kB
-
 MeanMedianSchweiz.svg 512 × 341; 12 kB
-

-
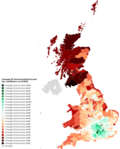
 Median Household Income per County as of 2021.png 6 900 × 4 326; 4,31 MB
-

-
 Nominal GDP IMF 2008 millions of USD.jpg 531 × 311; 27 kB
-
 Part salaire top 1 et 10 france.png 480 × 347; 18 kB
-
 Participacio treball.jpg 491 × 294; 42 kB
-
 Personal income diag.png 786 × 424; 37 kB
-
 Perteseche.svg 350 × 350; 12 kB
-
 Poland Median and Average Income from 2005 until 2917 EU SILC.svg 512 × 284; 21 kB
-
 Povertythresholds-census2003.jpg 748 × 356; 61 kB
-
 Ranglijst hoge inkomens.png 377 × 446; 11 kB
-
 Rapport interdécile france.png 480 × 347; 18 kB
-
 Real average annual wages in G7.svg 810 × 360; 114 kB
-
 RealCompEmpl.png 968 × 601; 33 kB
-
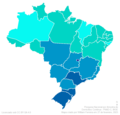 Renda per capita Brasil.png 802 × 768; 76 kB
-
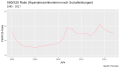
 Risk of Poverty and Social Exclustion NUTS2 NL 2017 EUSILC.svg 512 × 284; 48 kB
-
 Russia's wages.jpg 785 × 477; 58 kB
-
-
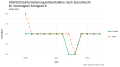
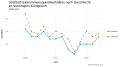
 S80S20 Einkommensquintilverhältnis in Irland 1995-2017 Eurostat.svg 512 × 284; 15 kB
-
 S80S20 Einkommensquintilverhältnis Irland 1995-2017 Eurostat.svg 512 × 284; 15 kB
-
-
-

-
-
 S80s20 ireland 2005-2016.svg 512 × 293; 11 kB
-
 S80S20 plot deutschland .svg 512 × 293; 9 kB
-
 S80s20 Ungarn 0517.svg 512 × 293; 17 kB
-
 S80S20neu Income Gender IE 2003-2017 EUSILC.svg 512 × 284; 13 kB
-
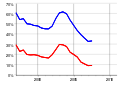
 S80S20neu Income Gender UK 2005-2017 EUSILC.svg 512 × 284; 12 kB
-
-
 Schweiz Mean und Median Einkommen.png 3 600 × 2 400; 88 kB
-

-
 Share of Top 10% on income in Croatia and the EU, 2010 - 2017.svg 512 × 284; 12 kB
-
 Shares of Income 2016 CBO.png 720 × 489; 50 kB
-
 Social indifference curves small.png 728 × 245; 12 kB
-
 Social-expenditures-2001-OCSE.png 1 425 × 625; 43 kB
-
 Spain household income.svg 1 200 × 750; 12 kB
-
 Theil Hoover.jpg 483 × 453; 26 kB
-
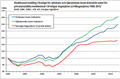
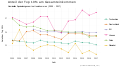 Top10% Income Share PL CZ DE EU LT SK 2005-2017 EUSILC.svg 512 × 284; 26 kB
-
 UK Average House Price.png 1 242 × 1 147; 453 kB
-
 UK Median Gross Household Income (excl. NI).png 1 404 × 1 063; 478 kB
-
 UsuryDurer.jpg 341 × 466; 64 kB
-
 Velfærdmodel.JPG 701 × 323; 56 kB
-
 Venezuela poverty percentages.svg 750 × 560; 8 kB
-
 Verfügbares Hauhaltseinkommen AT 2016.svg 512 × 284; 51 kB
-
 Verfügbares Hauhaltseinkommen HU 2016.svg 512 × 284; 49 kB
-
 Wage growth rates.JPG 885 × 547; 44 kB
-
 Wages in gdansk2.png 878 × 639; 152 kB
-
 WorldBank classification 2022.svg 2 754 × 1 398; 1,01 MB
-
 גרף הכנסות.png 554 × 323; 14 kB


.png)
.png)

.png)


_World_bank,_2016.png)


.png)


.svg)


.png)


