Category:Maps created by DemocracyATwork
Ukrainian parliamentary election, 2007[edit]
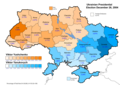
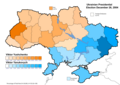
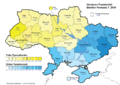
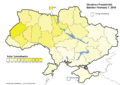
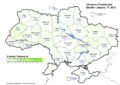
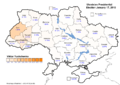
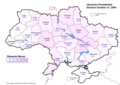
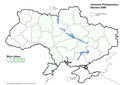
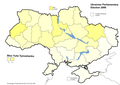
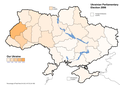
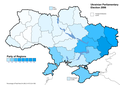
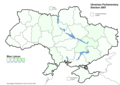
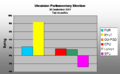
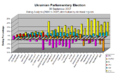
The collection of images below provide a graphical representation of the 2006 and 2007 Ukrainian Parliamentary Elections.
All data is derived from the published official results provided by the Ukrainian Authority (See links to source and data tables below)
It is important when analysing the information presented that the user notes that the information is based on National results and also as a percentage of the regional tally as provided by the Ukrainian Electoral Committee.
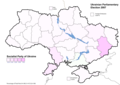
The swing analysis charts are based on the comparison of the 2006 to 2007 election results.
The carts are designed to show a correct correlation between each party and region by means of charts and color shaded maps. It is best that both maps and charts are displayed together.
Whilst we have produced a set of regional party maps based on the percentage of each region we recommend that editors use the maps based on the total national vote when providing comparisons between regions as this information is more statistically accurate and does not introduce a statical bias in the information presented.
Analysis comments[edit]
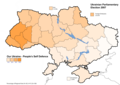
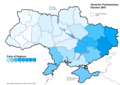
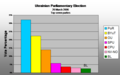
In 2006, 27% of the registered votes represented support for minor parties that received less than the 3% statutory representation threshold. In 2007 the number of voters that supported minor parties that received less than the 3% statutory threshold (Including the Socialist Party of Ukraine (2.86%) was only 7%. The 20% difference showed a consolidation of voters support towards major political parties. This fact needs to be taken into consideration when making assessments as to positive Swing in Bloc Yulia Tymochenko, Party of Regions, The Communist Party of Ukraine and Bloc Lytvyn. The Our Ukraine bloc merged with the new Party "People's Self-Defence" but only recorded a marginal gain in the overall percentage of the vote representing a reduction of 236,964 votes in comparison with the 2006 data.
Further review of the regional vote shows a consideration of the vote by Yulia Tymoshenko in regions in which here party already maintained strong support. Apart from the Socialist Party of Ukraine and a marginal gain by Our Ukraine all major Political parties recorded an increase in the percentage the voter support when comparing 2006 to 2007 results.
The other factor that needs to also be considered is that in 2006 the participation rate was 67% and in 2007 the participation rate dropped down to 62%.
Collection[edit]
Charts 2007[edit]
.PNG) |
.PNG) |
.PNG)
|
A swing analysis is common in any election. It shows the change in voter percentage for each party by regions from 2006 to 2007.
Maps 2007[edit]
v.PNG) |
v.PNG) |
v.PNG) |
v.PNG) |
v.PNG) |
v.PNG) |
a.PNG) |
a.PNG) |
a.PNG) |
a.PNG) |
a.PNG) |
a.PNG) |
.PNG) |
.PNG) |
.PNG) |
.PNG) |
.PNG) |
.PNG) |
Charts 2006[edit]
.PNG) |
.PNG) |
.PNG)
|
Maps 2006[edit]
.PNG)
v.PNG) |
v.PNG) |
v.PNG) |
v.PNG) |
v.PNG) |
v.PNG) |
a.PNG) |
a.PNG) |
a.PNG) |
a.PNG) |
a.PNG) |
a.PNG) |
Data tables[edit]
Regional results 2007[edit]
.PNG)
.PNG)
.PNG)
.PNG)
| Region | Voter enrolment | Turn-out % | PoR | BYuT | OU-PSD | CPU | BL | SPU |
|---|---|---|---|---|---|---|---|---|
| Ukraine | 37,185,882 | 62.70 | 34.4 | 30.7 | 14.2 | 5.4 | 4.0 | 2.9 |
| Eastern | 63.8 | 66.5 | 7.5 | 3.4 | 7.3 | 2.2 | 4.9 | |
| Donetsk Oblast | 3,620,888 | 66.0 | 76.0 | 4.5 | 2.0 | 6.8 | 1.0 | 1.3 |
| Luhansk Oblast | 1,898,637 | 66.3 | 73.5 | 5.1 | 1.7 | 8.5 | 2.4 | 1.3 |
| Kharkiv Oblast | 2,282,993 | 58.3 | 49.6 | 16.4 | 8.1 | 8.3 | 4.6 | 2.6 |
| Southern | 57.0 | 54.6 | 13.6 | 6.5 | 7.7 | 4.6 | 3.4 | |
| Autonomous Republic of Crimea | 1,568,070 | 55.8 | 61.0 | 6.9 | 8.2 | 7.6 | 3.9 | 1.9 |
| Zaporizhia Oblast | 1,515,832 | 61.4 | 55.5 | 14.7 | 4.7 | 8.3 | 5.5 | 2.3 |
| Mykolaiv Oblast | 971,038 | 57.6 | 54.4 | 16.6 | 5.8 | 7.2 | 4.5 | 1.9 |
| Odesa Oblast | 1,851,868 | 54.5 | 52.2 | 13.7 | 6.5 | 6.2 | 5.1 | 7.2 |
| Kherson Oblast | 893,442 | 55.5 | 43.2 | 23.1 | 9.1 | 9.1 | 3.7 | 2.5 |
| [[m. Sevastopol}Sevastopol']] | 308,928 | 59.7 | 64.5 | 5.0 | 2.3 | 10.3 | 2.5 | 2.7 |
| Center | 60.5 | 30.6 | 34.8 | 11.8 | 6.4 | 4.7 | 2.4 | |
| Vinnytsia Oblast | 1,342,608 | 64.5 | 12.6 | 50.0 | 18.6 | 5.0 | 3.1 | 2.5 |
| Dnipropetrovsk Oblast | 2,810,168 | 58.9 | 48.7 | 20.8 | 6.2 | 7.6 | 5.0 | 1.3 |
| Kirovohrad Oblast | 614,832 | 57.9 | 27.0 | 37.6 | 11.7 | 6.4 | 5.5 | 2.8 |
| Poltava Oblast | 1250,952 | 61.9 | 24.8 | 37.9 | 14.5 | 6.5 | 4.9 | 3.0 |
| Cherkasy Oblast | 1,095,058 | 60.1 | 15.5 | 47.0 | 15.3 | 4.9 | 4.9 | 4.3 |
| Northern | 62.5 | 16.7 | 45.5 | 16.1 | 4.9 | 5.7 | 2.1 | |
| Zhytomyr Oblast | 1,044,852 | 62.5 | 22.4 | 37.0 | 15.1 | 5.8 | 8.3 | 2.5 |
| Kyiv Oblast | 1,679,197 | 61.9 | 13.0 | 53.4 | 15.1 | 3.0 | 5.1 | 2.2 |
| Sumy Oblast | 990,575 | 62.0 | 15.7 | 44.5 | 20.8 | 5.8 | 3.3 | 2.0 |
| Chernihiv Oblast | 939,072 | 61.8 | 20.7 | 41.9 | 14.9 | 6.7 | 4.2 | 2.9 |
| Kyiv | 2,151,576 | 63.5 | 15.0 | 46.2 | 15.8 | 4.6 | 6.6 | 1.6 |
| Western | 68.4 | 8.3 | 48.9 | 29.1 | 1.8 | 3.2 | 1.6 | |
| Volyn Oblast | 801,557 | 71.0 | 6.7 | 57.6 | 20.0 | 2.7 | 4.6 | 1.9 |
| Zakarpattia Oblast | 946,525 | 52.1 | 19.8 | 28.9 | 31.1 | 1.8 | 6.0 | 3.5 |
| Ivano-Frankivsk Oblast | 1,080,296 | 72.6 | 3.0 | 50.7 | 36.8 | 0.8 | 1.0 | 0.8 |
| Lviv Oblast | 2,002,372 | 73.9 | 4.2 | 50.4 | 36.0 | 1.0 | 1.1 | 0.6 |
| Rivne Oblast | 865,092 | 68.7 | 10.4 | 51.0 | 20.8 | 2.4 | 6.1 | 2.1 |
| Ternopil Oblast | 870,214 | 76.5 | 3.0 | 51.6 | 35.2 | 0.7 | 1.6 | 1.1 |
| Khmelnytsky Oblast | 1,083,968 | 66.3 | 14.1 | 48.2 | 18.4 | 4.0 | 6.6 | 1.7 |
| Chernivtsi Oblast | 705,272 | 58.2 | 16.8 | 46.2 | 20.3 | 2.3 | 2.5 | 3.8 |
| Foreign Embassies | 431,142 | 6.0 | 26.5 | 33.1 | 25.5 | 1.6 | 2.3 | 1.2 |
National results 2007[edit]
| Parties and blocs | Votes | % | Seats | |
|---|---|---|---|---|
| Party of Regions (Партія регіонів) | 8,013,895 | 34.37 | 175 | |
| Yulia Tymoshenko Bloc (Блок Юлії Тимошенко) | 7,162,193 | 30.71 | 156 | |
| Our Ukraine–People's Self-Defense Bloc (Блок Наша Україна–Народна Самооборона) | 3,301,282 | 14.15 | 72 | |
| Communist Party of Ukraine (Комуністична партія України) | 1,257,291 | 5.39 | 27 | |
| Lytvyn Bloc (Блок Литвина) | 924,538 | 3.96 | 20 | |
| Socialist Party of Ukraine (Соціалістична партія України) | 668,234 | 2.86 | ||
| Progressive Socialist Party of Ukraine (Прогресивна соціалістична партія України) | 309,008 | 1.32 | ||
| All-Ukrainian Union "Freedom" (Всеукраїнське об'єднання "Свобода") | 178,660 | 0.76 | ||
| Party of Greens of Ukraine (Партія Зелених України) | 94,505 | 0.40 | ||
| Electoral Bloc of Liudmyla Suprun – Ukrainian Regional Asset (Виборчий блок Людмили Супрун — Український регіональний актив) | 80,944 | 0.34 | ||
| Communist Party of Ukraine (renewed) (Комуністична партія України (оновлена)) | 68,602 | 0.29 | ||
| Party of Free Democrats (Партія Вільних Демократів) | 50,852 | 0.21 | ||
| Bloc of the Party of Pensioners of Ukraine (Блок партії пенсіонерів України) | 34,845 | 0.14 | ||
| Party of National Economic Development of Ukraine (Партія національно-економічного розвитку України) | 33,489 | 0.14 | ||
| Ukrainian People's Bloc (Український Народний Блок) | 28,414 | 0.12 | ||
| Peasants' Bloc "Agrarian Ukraine" (Селянський Блок "Аграрна Україна") | 25,675 | 0.11 | ||
| Christian Bloc (Християнський блок) | 24,597 | 0.10 | ||
| Electoral Bloc of Political Parties "KUCHMA" (Виборчий блок політичних партій «КУЧМА») | 23,676 | 0.10 | ||
| Bloc "All-Ukrainian Community" (Блок "Всеукраїнська громада") | 12,327 | 0.05 | ||
| All-Ukrainian Party of People's Trust (Всеукраїнська партія Народної Довіри) | 5,342 | 0.02 | ||
| Against all | 637,185 | 2.73 | ||
| Invalid ballot papers | 379,658 | 1.62 | ||
| Total (turnout 62.02%) | 23,315,257 | 100 | 450 | |
| Source: Central Election Commission of Ukraine (English) | ||||
Regional results 2006[edit]
| Region | Voter enrolment | Turn-out % | PoR | BYuT | OU | SPU | CPU | BL | |
|---|---|---|---|---|---|---|---|---|---|
| Ukraine | 37163136 | 69.80 | 8145676 | 5650344 | 3537977 | 1443827 | 929174 | 619661 | |
| Eastern | |||||||||
| DonetskDonetsk Oblast | 60.89 | 1850729 | 62138 | 35456 | 94256 | 79062 | 8886 | ||
| Luhansk Oblast | 61.09 | 1003435 | 50109 | 27669 | 15848 | 59887 | 9891 | ||
| Kharkiv Oblast | 56.7 | 765901 | 187900 | 87644 | 40764 | 67676 | 34418 | ||
| Southern | |||||||||
| Autonomous Republic of Crimea | 54.34 | 585209 | 66067 | 76956 | 11926 | 45800 | 14012 | ||
| Zaporizhia Oblast | 59.45 | 519291 | 110934 | 53971 | 29565 | 54166 | 20843 | ||
| Mykolaiv Oblast | 57.1 | 314122 | 74223 | 34936 | 26650 | 33291 | 15820 | ||
| Odesa Oblast | 48.83 | 528171 | 109622 | 71694 | 69676 | 35386 | 42073 | ||
| Kherson Oblast | 55.56 | 219458 | 97756 | 54717 | 27057 | 37900 | 18966 | ||
| Sevastopol' | 63.12 | 134743 | 9507 | 5044 | 1716 | 9995 | 3259 | ||
| Center | |||||||||
| Vinnytsia Oblast | 63.39 | 78295 | 319413 | 192145 | 141162 | 32998 | 22085 | ||
| Dnipropetrovsk Oblast | 55.21 | 812661 | 271674 | 95667 | 68714 | 102222 | 52331 | ||
| Kirovohrad Oblast | 58.95 | 109521 | 164178 | 47521 | 52996 | 33156 | 27757 | ||
| Poltava Oblast | 59.59 | 176927 | 232758 | 114414 | 110617 | 47221 | 19497 | ||
| Cherkasy Oblast | 54.47 | 77440 | 277676 | 88410 | 97209 | 31759 | 22026 | ||
| Northern | |||||||||
| Zhytomyr Oblast | 61.06 | 129225 | 179207 | 126001 | 64103 | 38501 | 50904 | ||
| Kyiv Oblast | 51.94 | 98444 | 443966 | 115942 | 101406 | 22668 | 28049 | ||
| Sumy Oblast | 59.09 | 72949 | 222012 | 129513 | 70486 | 35800 | 15268 | ||
| Chernihiv Oblast | 59.2 | 100620 | 218649 | 66390 | 83025 | 35234 | 19249 | ||
| Kyiv | 58.85 | 171250 | 570808 | 230556 | 80114 | 43446 | 49425 | ||
| Western | |||||||||
| Volyn Oblast | 66.28 | 27090 | 264778 | 124766 | 24420 | 13486 | 19922 | ||
| Zakarpattia Oblast | 55.26 | 107664 | 117148 | 148901 | 21030 | 7327 | 20196 | ||
| Ivano-Frankivsk Oblast | 64.83 | 15517 | 242551 | 359621 | 18212 | 4703 | 8321 | ||
| Lviv Oblast | 65.12 | 45697 | 500420 | 574879 | 33049 | 10702 | 11635 | ||
| Rivne Oblast | 66.85 | 47006 | 203103 | 165323 | 41870 | 12085 | 28840 | ||
| Ternopil Oblast | 67.5 | 13617 | 232331 | 230079 | 24682 | 3005 | 9435 | ||
| Khmelnytsky Oblast | 64.86 | 78736 | 280179 | 144425 | 72559 | 24113 | 34592 | ||
| Chernivtsi Oblast | 56.05 | 57809 | 137834 | 122863 | 20375 | 7727 | 11705 | ||
| Foreign Embassies | 7218 | 5935 | 13637 | 737 | 275 | 500 |
Data source[edit]
2006
[7]
[8]
[9]
[10]
[11]
[12]
- ↑ 2007 Party of Regions (Партия Регионов) results (in Ukrainian) (2007-10-01).
- ↑ 2007 Bloc Yulia Tymoshenko(Блок Юлиа Тимошенко) results (in Ukrainian) (2007-10-01).
- ↑ 2007 Our Ukraine-Peoples Self Defence (Наша Украина Народная Самозащита) results (in Ukrainian) (2007-10-01).
- ↑ 2007 Communist Party of Ukraine(Социалистическая партия Украины) (in Ukrainian) (2007-10-01).
- ↑ 2007 Bloc Lytyn Party (Блок Литвина) results (in Ukrainian) (2007-10-01).
- ↑ 2007 Socialist Party of Ukraine (Социалистическая партия Украины )results (in Ukrainian) (2007-10-01).
- ↑ 2006 Party of Regions (Партия Регионов) results (in Ukrainian) (2006-3-27).
- ↑ 2006 Bloc Yulia Tymoshenko (Блок Юлиа Тимошенко) results (in Ukrainian) (2006-3-27).
- ↑ 2006 Our Ukraine (Наша Украина) results (in Ukrainian) (2006-3-27).
- ↑ 2006 Socialist Party of Ukraine (Социалистическая партия Украины) results (in Ukrainian) (2006-3-27).
- ↑ 2006 Commuist Party of Ukraine (Коммунистическая партия Украины) results (in Ukrainian) (2006-3-27).
- ↑ 2006 Bloc Lytvyn Party (Блок Литвина) results (in Ukrainian) (2006-3-27).
Licensing[edit]
| I, the copyright holder of this work, release this work into the public domain. This applies worldwide. In some countries this may not be legally possible; if so: I grant anyone the right to use this work for any purpose, without any conditions, unless such conditions are required by law. |
Media in category "Maps created by DemocracyATwork"
The following 73 files are in this category, out of 73 total.
-
 Ukraine Presidential Dec 2004 Vote (Highest vote).png 2,466 × 1,749; 624 KB
-
 Ukraine Presidential Dec 2004 Vote (Highest vote)a.png 2,466 × 1,749; 502 KB
-
 Ukraine Presidential Dec 2004 Vote (Yanukovych).png 2,466 × 1,749; 621 KB
-
 Ukraine Presidential Dec 2004 Vote (Yanukovych)a.png 2,466 × 1,749; 493 KB
-
 Ukraine Presidential Dec 2004 Vote (Yushchenko).png 2,466 × 1,749; 635 KB
-
 Ukraine Presidential Dec 2004 Vote (Yushchenko)a.png 2,466 × 1,749; 500 KB
-
 Ukraine Presidential Feb 2010 Vote (HighestVote).png 2,466 × 1,749; 674 KB
-
 Ukraine Presidential Feb 2010 Vote (Tymoshenko).png 2,466 × 1,749; 653 KB
-
 Ukraine Presidential Feb 2010 Vote (Tymoshenko)a.png 2,466 × 1,749; 518 KB
-
 Ukraine Presidential Feb 2010 Vote (Yanukovych).png 2,466 × 1,749; 630 KB
-
 Ukraine Presidential Feb 2010 Vote (Yanukovych)a.png 2,466 × 1,749; 498 KB
-
 Ukraine Presidential Jan 2010 Vote (Tihipko).png 2,466 × 1,749; 647 KB
-
 Ukraine Presidential Jan 2010 Vote (Tihipko)a.png 2,466 × 1,749; 574 KB
-
 Ukraine Presidential Jan 2010 Vote (TotalVote).png 2,466 × 1,749; 581 KB
-
 Ukraine Presidential Jan 2010 Vote (Tymoshenko).png 2,466 × 1,749; 647 KB
-
 Ukraine Presidential Jan 2010 Vote (Tymoshenko)a.png 2,466 × 1,749; 571 KB
-
 Ukraine Presidential Jan 2010 Vote (Yanukovych).png 2,466 × 1,749; 626 KB
-
 Ukraine Presidential Jan 2010 Vote (Yanukovych)a.png 2,466 × 1,749; 557 KB
-
 Ukraine Presidential Jan 2010 Vote (Yatseniuk).png 2,466 × 1,749; 610 KB
-
 Ukraine Presidential Jan 2010 Vote (Yatseniuk)a.png 2,466 × 1,749; 539 KB
-
 Ukraine Presidential Jan 2010 Vote (Yushchenko).png 2,466 × 1,749; 594 KB
-
 Ukraine Presidential Jan 2010 Vote (Yushchenko)a.png 2,466 × 1,749; 525 KB
-
 Ukraine Presidential Nov 2004 Vote (Yanukovych).png 2,466 × 1,749; 617 KB
-
 Ukraine Presidential Nov 2004 Vote (Yanukovych)a.png 2,466 × 1,749; 494 KB
-
 Ukraine Presidential Nov 2004 Vote (Yushchenko).png 2,466 × 1,749; 633 KB
-
 Ukraine Presidential Nov 2004 Vote (Yushchenko)a.png 2,466 × 1,749; 500 KB
-
 Ukraine Presidential Oct 2004 Vote (Moroz).png 2,466 × 1,749; 598 KB
-
 Ukraine Presidential Oct 2004 Vote (Moroz)a.png 2,466 × 1,749; 476 KB
-
 Ukraine Presidential Oct 2004 Vote (Yanukovych).png 2,466 × 1,749; 621 KB
-
 Ukraine Presidential Oct 2004 Vote (Yanukovych)a.png 2,466 × 1,749; 495 KB
-
 Ukraine Presidential Oct 2004 Vote (Yushchenko).png 2,466 × 1,749; 639 KB
-
 Ukraine Presidential Oct 2004 Vote (Yushchenko)a.png 2,466 × 1,749; 503 KB
-
 Ukrainian parliamentary election 2006 (BL)a.PNG 2,465 × 1,749; 285 KB
-
 Ukrainian parliamentary election 2006 (BL)v.PNG 2,465 × 1,749; 367 KB
-
 Ukrainian parliamentary election 2006 (BYuT)a.PNG 2,465 × 1,749; 289 KB
-
 Ukrainian parliamentary election 2006 (BYuT)v.PNG 2,465 × 1,749; 375 KB
-
 Ukrainian parliamentary election 2006 (CPU)a.PNG 2,466 × 1,750; 292 KB
-
 Ukrainian parliamentary election 2006 (CPU)v.PNG 2,466 × 1,750; 375 KB
-
 Ukrainian parliamentary election 2006 (HighestVote).PNG 2,465 × 1,749; 366 KB
-
 Ukrainian parliamentary election 2006 (OU)a.PNG 2,466 × 1,749; 300 KB
-
 Ukrainian parliamentary election 2006 (OU)v.PNG 2,466 × 1,749; 391 KB
-
 Ukrainian parliamentary election 2006 (PoR)a.PNG 2,465 × 1,749; 298 KB
-
 Ukrainian parliamentary election 2006 (PoR)v.PNG 2,465 × 1,749; 389 KB
-
 Ukrainian parliamentary election 2006 (SPU)a.PNG 2,465 × 1,749; 291 KB
-
 Ukrainian parliamentary election 2006 (SPU)v.PNG 2,465 × 1,749; 375 KB
-
 Ukrainian parliamentary election 2007 (BLP).PNG 2,466 × 1,749; 478 KB
-
 Ukrainian parliamentary election 2007 (BLP)a.PNG 2,465 × 1,749; 463 KB
-
 Ukrainian parliamentary election 2007 (BLP)v.PNG 2,465 × 1,749; 581 KB
-
 Ukrainian parliamentary election 2007 (BYuT).PNG 2,466 × 1,749; 478 KB
-
 Ukrainian parliamentary election 2007 (BYuT)a.PNG 2,465 × 1,749; 486 KB
-
 Ukrainian parliamentary election 2007 (BYuT)v.PNG 2,465 × 1,749; 617 KB
-
 Ukrainian parliamentary election 2007 (CPU).PNG 2,466 × 1,749; 486 KB
-
 Ukrainian parliamentary election 2007 (CPU)a.PNG 2,466 × 1,750; 484 KB
-
 Ukrainian parliamentary election 2007 (CPU)v.PNG 2,466 × 1,750; 606 KB
-
 Ukrainian parliamentary election 2007 (HighestVote).PNG 2,465 × 1,749; 567 KB
-
 Ukrainian parliamentary election 2007 (OU-PSD).PNG 2,466 × 1,749; 509 KB
-
 Ukrainian parliamentary election 2007 (OU-PSD)a.PNG 2,466 × 1,749; 501 KB
-
 Ukrainian parliamentary election 2007 (OU-PSD)v.PNG 2,466 × 1,749; 637 KB
-
 Ukrainian parliamentary election 2007 (PoR).PNG 2,466 × 1,749; 483 KB
-
 Ukrainian parliamentary election 2007 (PoR)a.PNG 2,465 × 1,749; 484 KB
-
 Ukrainian parliamentary election 2007 (PoR)v.PNG 2,465 × 1,749; 609 KB
-
 Ukrainian parliamentary election 2007 (SPU).PNG 2,466 × 1,749; 477 KB
-
 Ukrainian parliamentary election 2007 (SPU)a.PNG 2,465 × 1,749; 463 KB
-
 Ukrainian parliamentary election 2007 (SPU)v.PNG 2,465 × 1,749; 579 KB
-
 Ukrainian parliamentary election, 2006 (Percentage).PNG 769 × 478; 13 KB
-
 Ukrainian parliamentary election, 2006 (Results).PNG 772 × 477; 24 KB
-
 Ukrainian parliamentary election, 2006 (ResultsByRegion).PNG 768 × 480; 21 KB
-
 Ukrainian parliamentary election, 2007 (Percentage).PNG 768 × 477; 10 KB
-
 Ukrainian parliamentary election, 2007 (Results).PNG 772 × 477; 19 KB
-
 Ukrainian parliamentary election, 2007 (ResultsByRegion).PNG 768 × 480; 15 KB
-
 Ukrainian parliamentary election, 2007 (Swing).PNG 769 × 476; 9 KB
-
 Ukrainian parliamentary election, 2007 (SwingByRegion).PNG 767 × 477; 16 KB
-
 Ukrainian parliamentary election, 2007 (VoteByRegion).PNG 769 × 477; 16 KB
.png)
a.png)
.png)
a.png)
.png)
a.png)
.png)
.png)
a.png)
.png)
a.png)
.png)
a.png)
.png)
.png)
a.png)
.png)
a.png)
.png)
a.png)
.png)
a.png)
.png)
a.png)
.png)
a.png)
.png)
a.png)
.png)
a.png)
.png)
a.png)