File:2006-2007 South Pacific cyclone season summary.png
跳至導覽
跳至搜尋

預覽大小:800 × 500 像素。 其他解析度:320 × 200 像素 | 640 × 400 像素 | 1,024 × 640 像素 | 1,280 × 800 像素 | 2,560 × 1,600 像素 | 4,000 × 2,500 像素。
原始檔案 (4,000 × 2,500 像素,檔案大小:540 KB,MIME 類型:image/png)
說明
說明
添加單行說明來描述出檔案所代表的內容
摘要
[編輯]
| 描述 |
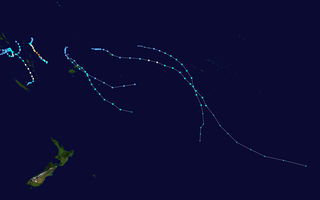
English: This map shows the tracks of all tropical cyclones in the 2006-07 South Pacific cyclone season. The points show the location of each storm at 6-hour intervals. The colour represents the storm's maximum sustained wind speeds as classified in the Saffir-Simpson Hurricane Scale (see below), and the shape of the data points represent the type of the storm.
Tropical depression (≤38 mph, ≤62 km/h)
Tropical storm (39–73 mph, 63–118 km/h)
Category 1 (74–95 mph, 119–153 km/h)
Category 2 (96–110 mph, 154–177 km/h)
Category 3 (111–129 mph, 178–208 km/h)
Category 4 (130–156 mph, 209–251 km/h)
Category 5 (≥157 mph, ≥252 km/h)
Unknown
Storm type |
| 來源 | Created using Wikipedia:WikiProject Tropical cyclones/Tracks. The background image is from NASA [1]. The tracking data is from the Joint Typhoon Warning Center's best track database |
| 作者 | Supportstorm |
| 此作品已由其作者,Supportstorm,釋出至公有領域。此授權條款在全世界均適用。 這可能在某些國家不合法,如果是的話: Supportstorm授予任何人有權利使用此作品於任何用途,除受法律約束外,不受任何限制。 |
檔案歷史
點選日期/時間以檢視該時間的檔案版本。
| 日期/時間 | 縮圖 | 尺寸 | 用戶 | 備註 | |
|---|---|---|---|---|---|
| 目前 | 2020年8月22日 (六) 03:09 | | 4,000 × 2,500(540 KB) | Supportstorm(對話 | 貢獻) | {{Hurricane season auto track map|start=October 20, 2006|end=April 6, 2007|source=JTWC|type=cyclone|basin=South Pacific|year=2006-07|author=Supportstorm}} |
無法覆蓋此檔案。
檔案用途
沒有使用此檔案的頁面。
全域檔案使用狀況
以下其他 wiki 使用了這個檔案:
- en.wikipedia.org 的使用狀況
- pt.wikipedia.org 的使用狀況
- zh.wikipedia.org 的使用狀況