File:2013 week 40 Daily Weather Map color summary NOAA.pdf
Jump to navigation
Jump to search

Size of this JPG preview of this PDF file: 463 × 599 pixels. Other resolutions: 185 × 240 pixels | 371 × 480 pixels | 593 × 768 pixels | 1,275 × 1,650 pixels.
Original file (1,275 × 1,650 pixels, file size: 18.61 MB, MIME type: application/pdf, 16 pages)
Captions
Captions
Add a one-line explanation of what this file represents
Summary[edit]
| Description |
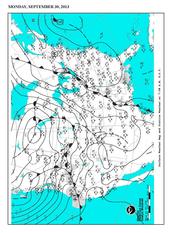
English: A weekly summary of color weather maps for 2013, week 40.
|
| Date | 2013, week 40 |
| Source | National Centers for Environmental Prediction |
| Author | National Centers for Environmental Prediction |
Licensing[edit]
This image is in the public domain because it contains materials that originally came from the U.S. National Oceanic and Atmospheric Administration, taken or made as part of an employee's official duties.
|
File history
Click on a date/time to view the file as it appeared at that time.
| Date/Time | Thumbnail | Dimensions | User | Comment | |
|---|---|---|---|---|---|
| current | 06:48, 19 October 2013 |  | 1,275 × 1,650, 16 pages (18.61 MB) | Noaabot (talk | contribs) | == {{int:filedesc}} == {{NOAA-dailywxmap|type=colorweeklypdf|date=2013, week 40|description=Comment: ''Color PDF file from 09.30.13 to 10.06.13}} == {{int:license}} == {{PD-USGov-NOAA}} Category:2013 NCEP weather maps [[Category:Images from NOAA up... |
You cannot overwrite this file.
File usage on Commons
There are no pages that use this file.