File:After tax household income in the US.svg
跳转到导航
跳转到搜索

此SVG文件的PNG预览的大小:483 × 599像素。 其他分辨率:193 × 240像素 | 387 × 480像素 | 619 × 768像素 | 826 × 1,024像素 | 1,652 × 2,048像素 | 750 × 930像素。
原始文件 (SVG文件,尺寸为750 × 930像素,文件大小:16 KB)
说明
说明
添加一行文字以描述该文件所表现的内容
摘要
[编辑]
| 描述 |
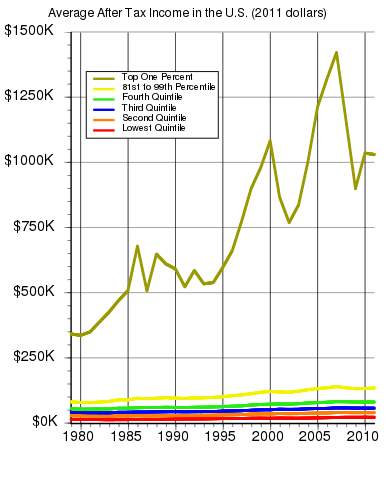
English: After tax household income in the United States for each quintile from 1979 to 2011. The percentage increase (inflation adjusted) in the lowest quintile was 48%, in the second quintile, 37%, in the third quintile 35%, in the fourth quintile 45%, for the 81st to 99th percentile 64%, and for the top one percent, 200%. Data source: The Distribution of Household Income and Federal Taxes, 2011 |
| 日期 | |
| 来源 | 自己的作品 |
| 作者 | Delphi234 |
Generated with Wikimedia SVG Chart
[编辑]
| Data format | The source data of the chart is in the SVG image file in a clearly readable format. You see the original numbers inside of the SVG file in the form of a list such as this:
... 1995 10.06 1996 11.75 1997 12.45 ... |
| Content of SVG | To view the data download the SVG file itself. To do so right-click this link, and then choose the option to save: File:After tax household income in the US.svg. Launch any text editor. Open the downloaded SVG file with the text editor (usually; file menu, open). To see the list of data, search for the phrase id="graph1". |
| Please, do not use a special SVG editor such as Inkscape; the readability of the database would be destroyed. You can edit the SVG file with any text editor, for example; en: List of text editors. You can view the edited SVG file in various web browsers. As of 2011, all major desktop browsers, and many minor ones, have some level of SVG support. See: en: Scalable Vector Graphics#Support for SVG in web browsers. When satisfied with your edits, upload the edited SVG file with the link labeled "Upload a new version of this file".
W3C-validity not checked. This chart was created with Wikimedia SVG Chart. 此SVG 文件使用了内嵌文本,其中只包含数字。 |
|
| Code to generate SVG | See: File talk:After tax household income in the US.svg. Documentation see: Wikimedia SVG Chart. |

|
This file may be updated to reflect new information. If you wish to use a specific version of the file without it being overwritten, please upload the required version as a separate file. |
许可协议
[编辑]
我,本作品著作权人,特此采用以下许可协议发表本作品:
| 本作品采用知识共享CC0 1.0 通用公有领域贡献许可协议授权。 | |
| 采用本宣告发表本作品的人,已在法律允许的范围内,通过在全世界放弃其对本作品拥有的著作权法规定的所有权利(包括所有相关权利),将本作品贡献至公有领域。您可以复制、修改、传播和表演本作品,将其用于商业目的,无需要求授权。
|
Any autoconfirmed user can overwrite this file from the same source. Please ensure that overwrites comply with the guideline.
文件历史
点击某个日期/时间查看对应时刻的文件。
| 日期/时间 | 缩略图 | 大小 | 用户 | 备注 | |
|---|---|---|---|---|---|
| 当前 | 2016年4月16日 (六) 07:20 | | 750 × 930(16 KB) | Delphi234(留言 | 贡献) | legend |
| 2016年3月16日 (三) 01:05 |  | 750 × 930(16 KB) | Delphi234(留言 | 贡献) | User created page with UploadWizard |
您不可以覆盖此文件。
文件用途
以下页面使用本文件:
全域文件用途
以下其他wiki使用此文件:
- en.wikipedia.org上的用途
- zh.wikipedia.org上的用途