File:Folio Plot BCG Matrix Example.png
Salta a la navegació
Salta a la cerca

Mida d'aquesta previsualització: 594 × 599 píxels. Altres resolucions: 238 × 240 píxels | 476 × 480 píxels | 762 × 768 píxels | 1.015 × 1.024 píxels | 2.031 × 2.048 píxels | 2.816 × 2.840 píxels.
Fitxer original (2.816 × 2.840 píxels, mida del fitxer: 75 Ko, tipus MIME: image/png)
Llegendes
Llegendes
Afegeix una explicació d'una línia del que representa aquest fitxer
Resum
[modifica]
| Descripció |
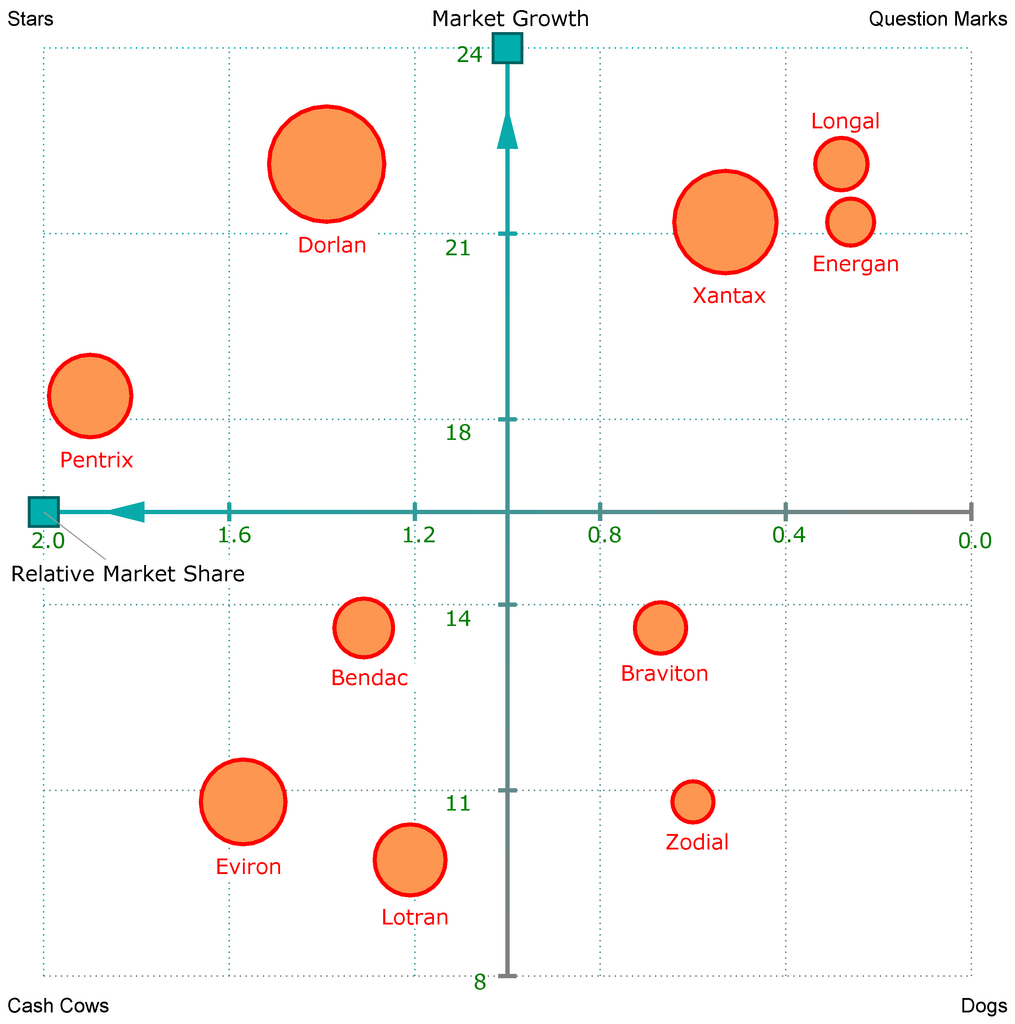
English: Folio plot of a BCG matrix analysis using an example data set. The folio plot visualizes the relative market share of a portfolio (hence the name) of products versus the growth of their market. The measurements are visualized as squares, and the objects as circles that differ in size by their sales volume. The PNG was created with Foliomap. |
| Data | |
| Font | Template:Ericmelse |
| Autor | Ericmelse |
Llicència
[modifica]
Jo, el titular dels drets d'autor d'aquest treball, el public sota la següent llicència:
Aquest fitxer està subjecte a la llicència de Creative Commons Reconeixement 3.0 No adaptada.
- Sou lliure de:
- compartir – copiar, distribuir i comunicar públicament l'obra
- adaptar – fer-ne obres derivades
- Amb les condicions següents:
- reconeixement – Heu de donar la informació adequada sobre l'autor, proporcionar un enllaç a la llicència i indicar si s'han realitzat canvis. Podeu fer-ho amb qualsevol mitjà raonable, però de cap manera no suggereixi que l'autor us dóna suport o aprova l'ús que en feu.
Historial del fitxer
Cliqueu una data/hora per veure el fitxer tal com era aleshores.
| Data/hora | Miniatura | Dimensions | Usuari/a | Comentari | |
|---|---|---|---|---|---|
| actual | 12:40, 22 feb 2010 | | 2.816 × 2.840 (75 Ko) | Ericmelse (discussió | contribucions) | {{Information |Description={{en|1=Folio plot of a BCG Matrix Analysis using an example data set. The folio plot visualizes the relative market share of a portfolio (hence the name) of products versus the growth of their market. The measurements are visual |
No podeu sobreescriure aquest fitxer.
Ús del fitxer
No hi ha pàgines que utilitzin aquest fitxer.
Ús global del fitxer
Utilització d'aquest fitxer en altres wikis:
- Utilització a ca.wikipedia.org
- Utilització a en.wikipedia.org
- Utilització a fa.wikipedia.org
- Utilització a he.wikipedia.org
- Utilització a hy.wikipedia.org
- Utilització a id.wikipedia.org
- Utilització a ja.wikipedia.org
- Utilització a ko.wikipedia.org
- Utilització a la.wikipedia.org
- Utilització a ms.wikipedia.org
- Utilització a sv.wikipedia.org
- Utilització a th.wikipedia.org
- Utilització a uk.wikipedia.org
- Utilització a uz.wikipedia.org
- Utilització a zh-yue.wikipedia.org
- Utilització a zh.wikipedia.org