File:Perturbación.svg
Jump to navigation
Jump to search

Size of this PNG preview of this SVG file: 700 × 550 pixels. Other resolutions: 306 × 240 pixels | 611 × 480 pixels | 978 × 768 pixels | 1,280 × 1,006 pixels | 2,560 × 2,011 pixels.
Original file (SVG file, nominally 700 × 550 pixels, file size: 143 KB)
Captions
Captions
Add a one-line explanation of what this file represents
Summary[edit]
| Description |
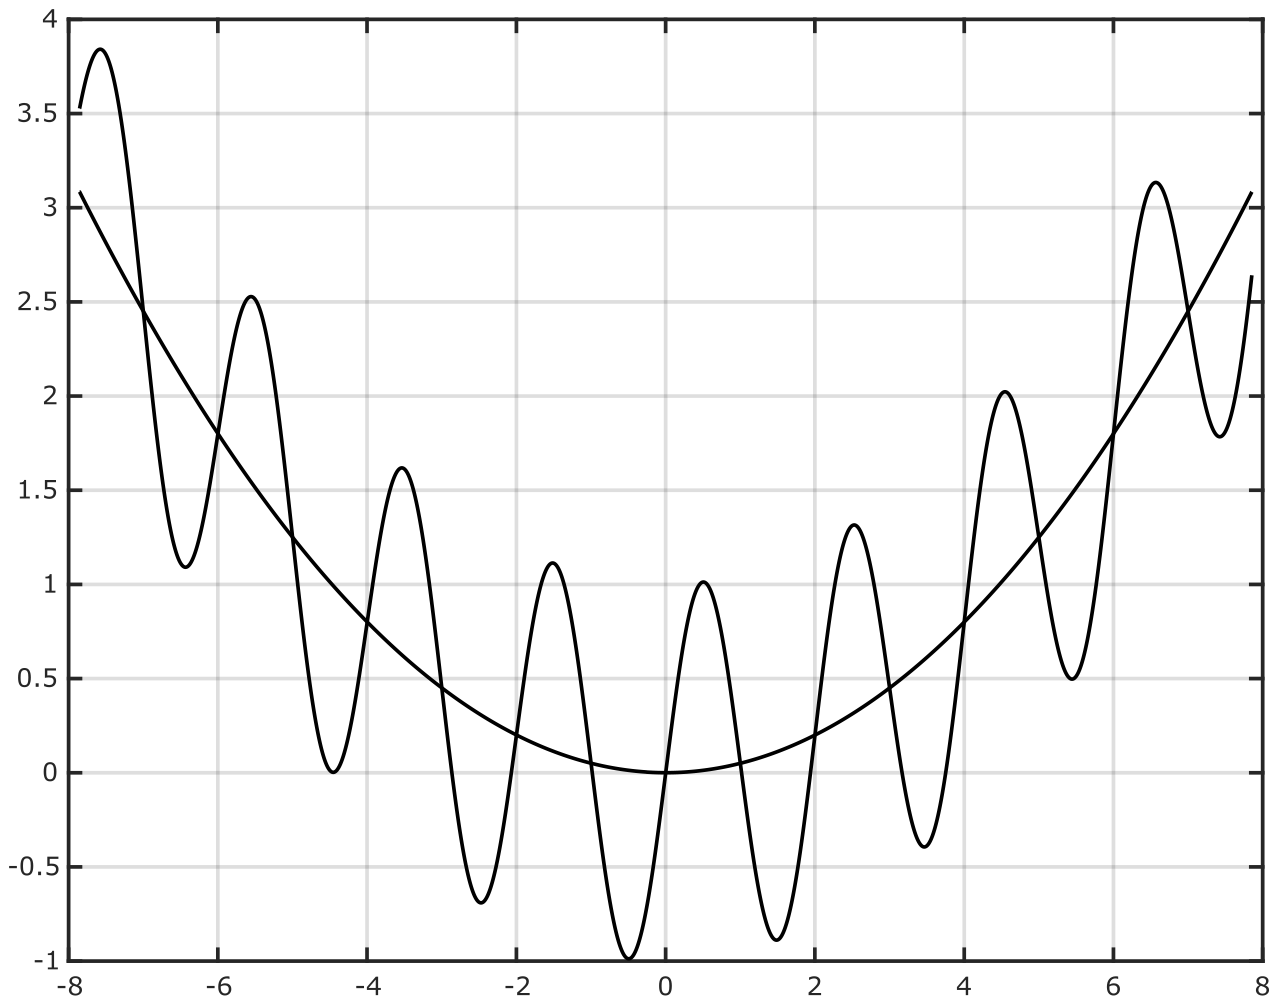
Deutsch: Vergleich zwischen "x*x/20" und "x*x/20 + sin(x pi)" English: Comparison between"x*x/20" and "x*x/20 + sin(x pi)" Español: Comparativa entre "x*x/20" y "x*x/20 + sin(x pi)" |
|||
| Date | ||||
| Source | Own work | |||
| Author | Andel | |||
| Permission (Reusing this file) |
|
|||
| Other versions | File:Perturbación.GIF | |||
| SVG development | ||||
| Source code | MATLAB code>> x = linspace(-2.5*pi,2.5*pi,1000000);
>> y1 = x.*x/20;
>> y2 = x.*x/20 + sin(x.*pi);
>> plot(x,y1,x,y2,'Color',[0,0,0])
|
File history
Click on a date/time to view the file as it appeared at that time.
| Date/Time | Thumbnail | Dimensions | User | Comment | |
|---|---|---|---|---|---|
| current | 13:17, 24 May 2020 | | 700 × 550 (143 KB) | Andel (talk | contribs) | Bolder lines to increase visibility |
| 13:12, 24 May 2020 |  | 700 × 550 (143 KB) | Andel (talk | contribs) | {{Information |description=|Description={{de|1=Vergleich zwischen "x*x/20" und "x*x/20 + sin(x pi)"}}{{en|1=Comparison between"x*x/20" and "x*x/20 + sin(x pi)"}}{{es|1=Comparativa entre "x*x/20" y "x*x/20 + sin(x pi)"}} |date= 2020-05-24 |source={{own}} |author=Andel |permission= {{PD-chart}} |other versions= File:Perturbación.GIF |other fields={{Igen|MATLAB|0|+|code= >> x = linspace(-2.5*pi,2.5*pi,1000000); >> y1 = x.*x/20; >> y2 = x.*x/20 + sin(x.*pi); >> plot(x,y1,x,y2... |
You cannot overwrite this file.
File usage on Commons
The following page uses this file:
File usage on other wikis
The following other wikis use this file:
- Usage on ast.wikipedia.org
- Usage on es.wikipedia.org