File:Population of Detroit Michigan.png
Jump to navigation
Jump to search
Size of this preview: 800 × 600 pixels. Other resolutions: 320 × 240 pixels | 640 × 480 pixels | 1,024 × 768 pixels | 1,200 × 900 pixels.
Original file (1,200 × 900 pixels, file size: 79 KB, MIME type: image/png)
Captions
Captions
Add a one-line explanation of what this file represents
| Description |
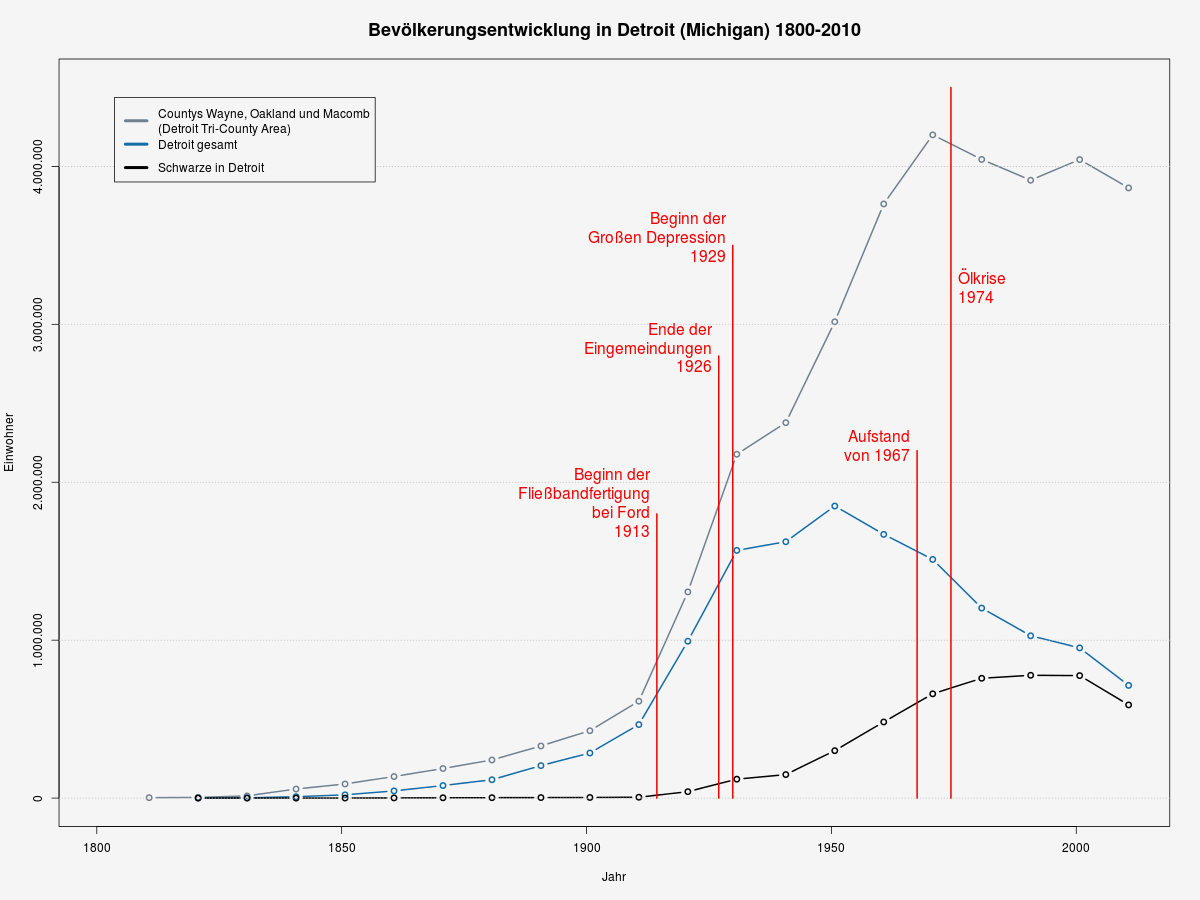
English: Population of Detroit, Michigan from 1810 to 2010. (Labels are in German.)
Deutsch: Bevölkerungsentwicklung in Detroit im US-Bundesstaat Michigan von 1810 bis 2010 (deutsche Beschriftung). |
| Date | |
| Source |
English: created with GNU R, see below
Deutsch: erstellt mit GNU R, siehe unten |
| Author |
Johnny S. partially derived from NRW in Aut.png by Thomas Steiner |
| Permission (Reusing this file) |
CC-by-sa-2.5 |
This file is licensed under the Creative Commons Attribution-Share Alike 2.5 Generic license.
- You are free:
- to share – to copy, distribute and transmit the work
- to remix – to adapt the work
- Under the following conditions:
- attribution – You must give appropriate credit, provide a link to the license, and indicate if changes were made. You may do so in any reasonable manner, but not in any way that suggests the licensor endorses you or your use.
- share alike – If you remix, transform, or build upon the material, you must distribute your contributions under the same or compatible license as the original.
Derivative works of this file: Vaestonkehitys Detroitissa 1800-2020.png by Inehmo
 ### R source code ###

 # years
  censusData=c("1800", "1810", "1820", "1830", "1840", "1850", "1860", "1870", "1880", "1890", "1900", "1910", "1920", "1930", "1940", "1950", "1960", "1970", "1980", "1990", "2000", "2010")
  censusData=as.Date(censusData, format="%Y")

 # three counties Wayne+Oakland+Macomb
 threeCountyArea=c( NA,  2227+0+580, 3574+330+898, 6781+4911+2413, 24173+23646+9716, 42756+31270+15530, 75547+38261+22843, 119068+40867+27616, 168444+41537+31627, 257144+41245+31813, 348793+44792+33244, 531591+49576+32606, 1177645+90050+38103, 1888946+211251+77146, 2015623+254068+107638,  2435235+396001+184961, 2666297+690259+405804, 2666751+907871+625309, 2337891+1011793+694600, 2111687+1083592+717400, 2061162+1194156+788149, 1820584+1202362+840978)
 detroit        =c( NA, NA, 1422, 2222, 9102, 21019, 45619, 79577, 116340, 205876, 285704, 465766, 993678, 1568662, 1623452, 1849568, 1670144, 1511482, 1203339, 1027974, 951270, 713777)
 blacksInDetroit=c( NA, NA,   67,  126,  193,   587,  1403,  2235,   2821,   3431,   4111,   5741,  40838,  120066,  149119,  300506,  482223,  660428,  758939,  777916, 775772, 590226)

 farben=c("slategrey", "#126ca8", "black")

 png(filename="Population_of_Detroit_Michigan.png", width=1200, height=900, pointsize=12, bg="whitesmoke")

 plot(censusData, threeCountyArea, type="b", col=farben[1], lwd=2, ylim=c(0,4500000), yaxt="n", xlab="", ylab="")
 lines(censusData, detroit, type="b", col=farben[2], lwd=2)
 lines(censusData, blacksInDetroit, type="b", col=farben[3], lwd=2)

 title(main="Bevölkerungsentwicklung in Detroit (Michigan) 1800-2010", cex.main=1.5, xlab="Jahr", ylab="Einwohner", col.lab="black")

 yticks=axTicks(side=2)
 axis(side=2, at=yticks, labels=c("0", "1.000.000", "2.000.000", "3.000.000", "4.000.000"), col="black")
 grid(NA, NULL, lwd=1, col="grey")

 legend(x="topleft", inset=0.05, legend=c("Countys Wayne, Oakland und Macomb\n(Detroit Tri-County Area)", "Detroit gesamt", "Schwarze in Detroit"), lwd=4, col=farben, bg="whitesmoke")

 # 1913 start of assembly line
 lines(x=c(-20321, -20321), y=c(0, 1800000), col="red2", lwd=2)
 text(x=-20321, y=1800000, pos=2, label="Beginn der\nFließbandfertigung\nbei Ford\n1913", col="red2", cex=1.3)
 # 1926 period of annexations ends
 lines(x=c(-15706, -15706), y=c(0, 2800000), col="red2", lwd=2)
 text(x=-15706, y=2800000, pos=2, label="Ende der\nEingemeindungen\n1926", col="red2", cex=1.3)
 # 1929 Great Depression
 lines(x=c(-14660, -14660), y=c(0, 3500000), col="red2", lwd=2)
 text(x=-14660, y=3500000, pos=2, label="Beginn der\nGroßen Depression\n1929", col="red2", cex=1.3)
 # 1967 riot
 lines(x=c(-913, -913), y=c(0, 2200000), col="red2", lwd=2)
 text(x=-913, y=2200000, pos=2, label="Aufstand\nvon 1967", col="red2", cex=1.3)
 # 1974 oil crisis
 lines(x=c(1611, 1611), y=c(0, 4500000), col="red2", lwd=2)
 text(x=1611, y=3200000, pos=4, label="Ölkrise\n1974", col="red2", cex=1.3)

 dev.off()
File history
Click on a date/time to view the file as it appeared at that time.
| Date/Time | Thumbnail | Dimensions | User | Comment | |
|---|---|---|---|---|---|
| current | 15:37, 10 September 2013 | | 1,200 × 900 (79 KB) | Johnny S. (talk | contribs) | {{Information |Description= {{en|Population of Detroit, Michigan from 1810 to 2010. (Labels are in German.)}} {{de|Bevölkerungsentwicklung in Detroit im US-Bundesstaat Michigan von 1810 bis 2010 (deutsche Beschriftung).}} |Source= {{en|created with GN... |
You cannot overwrite this file.
File usage on Commons
There are no pages that use this file.
File usage on other wikis
The following other wikis use this file:
- Usage on de.wikipedia.org