File:Standing wave nulls.svg
Jump to navigation
Jump to search

Size of this PNG preview of this SVG file: 730 × 470 pixels. Other resolutions: 320 × 206 pixels | 640 × 412 pixels | 1,024 × 659 pixels | 1,280 × 824 pixels | 2,560 × 1,648 pixels.
Original file (SVG file, nominally 730 × 470 pixels, file size: 49 KB)
Captions
Captions
Add a one-line explanation of what this file represents
| Description |
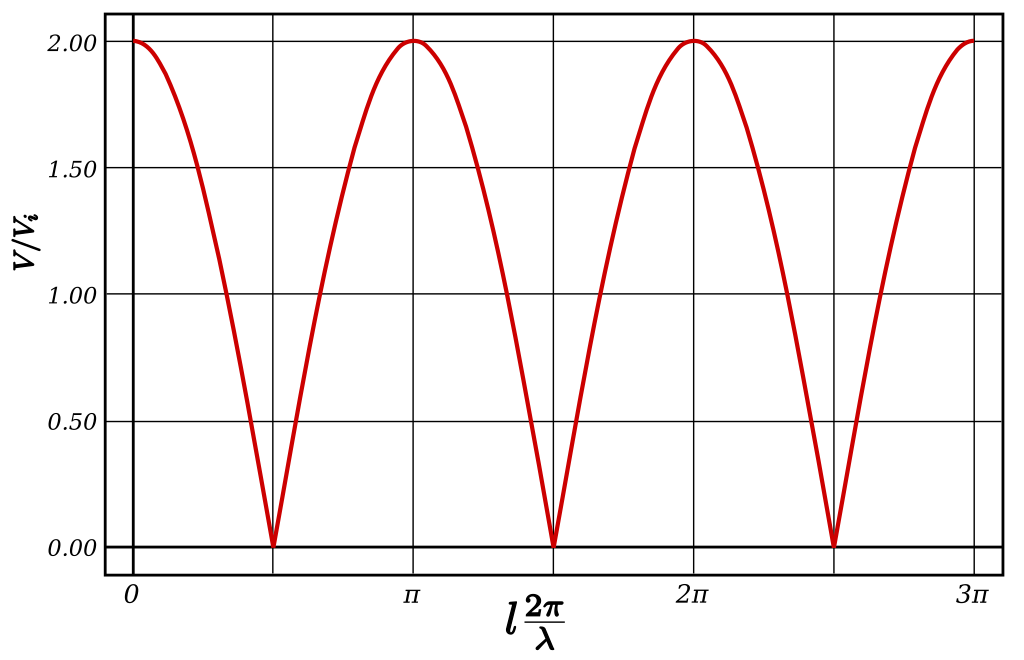
English: A diagram of a maximum voltage over time (V'mot) along a uniform, lossless, transmission line. This is determined by: :: ::where: ::*ρ is the magnitude of the reflection coefficient. ::*A is the ampliutude (in volts) ::*k is the wavenumber ::*x is the distance along the wire at which we measure Here, ρ is set to a range of values and A and k are set to 1. Note that this varies between a constant (equal to A) at 'ρ=0 and a rectified sinusoid of amplitude 4A. |
| Date | (UTC) |
| Source | |
| Author |
|

| This is a retouched picture, which means that it has been digitally altered from its original version. Modifications: Simplified version to highlight nulls. The original can be viewed here: Standing Wave Ratio.svg:
|
I, the copyright holder of this work, hereby publish it under the following license:
| I, the copyright holder of this work, release this work into the public domain. This applies worldwide. In some countries this may not be legally possible; if so: I grant anyone the right to use this work for any purpose, without any conditions, unless such conditions are required by law. |
Original upload log[edit]
This image is a derivative work of the following images:
- File:Standing_Wave_Ratio.svg licensed with PD-self
- 2009-01-25T04:39:36Z Inductiveload 720x460 (68861 Bytes) {{Information |Description={{en|1=A diagram of a maximum voltage over time (''V'mot) along a uniform, lossless, transmission line. This is determined by: ::V_\mathrm{mot} = A \sqrt {4\rho\cos^2 kx+(1-\rho)^2}. ::where: ::*ρ
Uploaded with derivativeFX
File history
Click on a date/time to view the file as it appeared at that time.
| Date/Time | Thumbnail | Dimensions | User | Comment | |
|---|---|---|---|---|---|
| current | 13:45, 11 July 2010 | | 730 × 470 (49 KB) | Spinningspark (talk | contribs) | {{Information |Description={{en|1=A diagram of a maximum voltage over time (''V'<sub>mot</sub>) along a uniform, lossless, transmission line. This is determined by: ::<math>V_mathrm{mot} = A sqrt {4rhocos^2 kx+(1-rho)^2}.</math> ::where: ::*ρ is the magn |
You cannot overwrite this file.
File usage on Commons
There are no pages that use this file.
File usage on other wikis
The following other wikis use this file:
- Usage on en.wikipedia.org