File:Sunspot-co2.jpg
跳至導覽
跳至搜尋
預覽大小:745 × 600 像素。 其他解析度:298 × 240 像素 | 596 × 480 像素 | 971 × 782 像素。
原始檔案 (971 × 782 像素,檔案大小:71 KB,MIME 類型:image/jpeg)
說明
說明
添加單行說明來描述出檔案所代表的內容

|
File:Temp-sunspot-co2.svg是本檔案的向量版本。 如果品質不低,就應該優先使用該檔案,而非JPG檔案。
File:Sunspot-co2.jpg → File:Temp-sunspot-co2.svg
更多資訊請參閱Help:SVG/zh。 |
 |
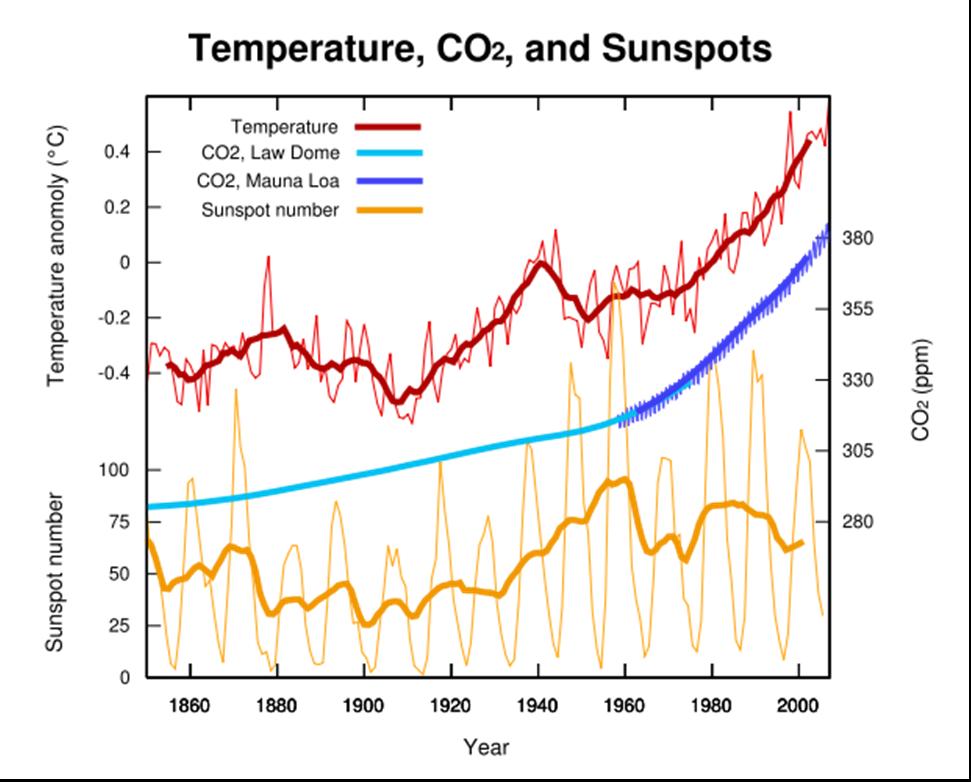
- English: Global average temperature, atmospheric CO2, and sunspot activity since 1850. Thick lines for temperature and sunspots represent a 25 year moving average smoothing of the raw data
Français : Evolution récente de la température mondiale moyenne et du taux moyen de CO2 atmosphérique, comparé à l'activité des w:fr:taches solairestaches solaires depuis 1850. Les lignes épaisses de variation de température et de taches solaires représentent un lissage des données (sur 25 années de données brutes)
Source
[編輯]
Data Sources
[編輯]
- (light blue) Law Dome CO2 Data: ftp://ftp.ncdc.noaa.gov/pub/data/paleo/icecore/antarctica/law/law_co2.txt
- (blue) Mauna Loa CO2 data:http://www.esrl.noaa.gov/gmd/ccgg/trends/co2_mm_mlo.dat
- (red) Temperature Data: http://www.cru.uea.ac.uk/cru/data/temperature/hadcrut3gl.txt archive copy at the Wayback Machine
- (orange) Sunspot data:http://sidc.oma.be/DATA/yearssn.dat archive copy at the Wayback Machine
Plot Generation
[編輯]
本JPG 點陣圖使用Matplotlib創作。
The plot was generated by the following Python script:
# -*- coding: utf-8 -*-
import numpy as np
import matplotlib.pylab as plt
import urllib

def smooth(signal, window_size):
    extended_signal = signal[window_size:0:-1] + signal + signal[-1:-window_size:-1]
    s = np.array(extended_signal)
    w = np.hamming(window_size)
    y = np.convolve(w/w.sum(), s, mode="same")
    return y[window_size:-window_size+1]

temp_file = urllib.urlopen("http://www.cru.uea.ac.uk/cru/data/temperature/hadcrut3gl.txt")
data_rows = [x.split() for x in temp_file][0:-1:2]
temp_years = [int(x[0]) for x in data_rows]
temps = [float(x[-1]) for x in data_rows]

#co2_file = urllib.urlopen("http://web.archive.org/web/20070829134646/http://www.esrl.noaa.gov/gmd/ccgg/trends/co2_mm_mlo.dat")
co2_file = urllib.urlopen("ftp://ftp.cmdl.noaa.gov/ccg/co2/trends/co2_mm_mlo.txt")
data_rows = [x.split() for x in co2_file if not x.startswith("#") and x.find("-99.99") == -1]
co2_years = [(float(x[0]) + (float(x[1])-0.5)/12.) for x in data_rows]
co2concs = [float(x[3]) for x in data_rows]

lawco2_file = urllib.urlopen("ftp://ftp.ncdc.noaa.gov/pub/data/paleo/icecore/antarctica/law/law_co2.txt")
data_rows = [x.split() for x in lawco2_file if x.startswith("     1")]
del data_rows[[float(x[0]) for x in data_rows].index(1010.):]
lawco2_years = [float(x[0]) for x in data_rows]
lawco2concs = [float(x[-1]) for x in data_rows]

sunspot_file = urllib.urlopen("http://sidc.oma.be/DATA/yearssn.dat")
data_rows = [x.split() for x in sunspot_file if "*" not in x]
sun_years = [float(x[0]) for x in data_rows]
sunspots = [float(x[-1]) for x in data_rows]

smoothed_temps = smooth(temps, 25)
smoothed_sunspots = smooth(sunspots, 25)

base_ax = plt.axes()
base_ax.yaxis.tick_left()
plt.yticks([])
plt.xlim(1850,2012)
plt.xlabel("Year", size=16)
plt.title("Temperature, CO$_2$, and Sunspots", size=22)

temp_ax = plt.axes([0.125,0.5,0.775,0.4], frameon=False)
temp_ax.yaxis.tick_left()
plt.plot(temp_years, temps, '#FF2200')
tline  = plt.plot(temp_years, smoothed_temps, '#AA0000', lw=3)
plt.xlim(1850,2012)
plt.yticks(np.arange(-0.6,0.6,0.2))
plt.ylabel(u'Temperature anomaly (C)', size=14)
plt.xticks([])

co2_ax = plt.axes([0.125,0.3,0.775,0.4], frameon=False)
co2_ax.yaxis.tick_right()
co2_ax.yaxis.set_label_position("right")
co2_ax.xaxis.tick_bottom()
plt.plot(co2_years, co2concs, '#44AAFF')
cline = plt.plot(lawco2_years, lawco2concs, '#2288EE', lw=2)
plt.xlim(1850,2012)
plt.ylabel(r'CO$_2$ (ppm)', size=14)
plt.xticks([])

sun_ax = plt.axes([0.125,0.1,0.775,0.4], frameon=False)
sun_ax.yaxis.tick_left()
plt.plot(sun_years, sunspots, "#FFDD00")
sline = plt.plot(sun_years, smoothed_sunspots, "#FF9900", lw=3)
plt.xlim(1850,2012)
plt.yticks(np.arange(0,200,50))
plt.ylabel("Sunspot number", size=14)
plt.xticks([])

plt.axes(base_ax)
plt.legend((tline, cline, sline), ("Temperature", "CO$_2$", "Sunspots"), "upper left")
plt.savefig("temp-co2-sunspot.svg")
plt.show()
The plot can likely be updated for more recent data using these same script, though minor modifications may be required for changes in data formats, locations, etc.
我,本作品的著作權持有者,決定用以下授權條款發佈本作品:
| 此檔案採用創用CC 姓名標示-相同方式分享 3.0 未在地化版本授權條款。 受免責聲明的約束。 | ||
| ||
| 已新增授權條款標題至此檔案,作為GFDL授權更新的一部份。 |

|
已授權您依據自由軟體基金會發行的無固定段落、封面文字和封底文字GNU自由文件授權條款1.2版或任意後續版本,對本檔進行複製、傳播和/或修改。該協議的副本列在GNU自由文件授權條款中。 受免責聲明的約束。 |
檔案歷史
點選日期/時間以檢視該時間的檔案版本。
| 日期/時間 | 縮圖 | 尺寸 | 使用者 | 備註 | |
|---|---|---|---|---|---|
| 目前 | 2007年6月17日 (日) 10:12 | | 971 × 782(71 KB) | Szdori(留言 | 貢獻) | *en: Global average temperature, atmospheric CO2, and sunspot activity since 1850. *Source: [http://en.wikipedia.org/wiki/Image:Temp-sunspot-co2.svg] {{GFDL-self-with-disclaimers}} |
無法覆蓋此檔案。
檔案用途
下列2個頁面有用到此檔案:
全域檔案使用狀況
以下其他 wiki 使用了這個檔案:
- fa.wikipedia.org 的使用狀況