File:1982- Deaths from mass shootings in the U.S - scatterplot and line chart.svg
קפיצה לניווט
קפיצה לחיפוש

גודל התצוגה המקדימה הזאת מסוג PNG של קובץ ה־SVG הזה: 800 × 600 פיקסלים. רזולוציות אחרות: 320 × 240 פיקסלים | 640 × 480 פיקסלים | 1,024 × 768 פיקסלים | 1,280 × 960 פיקסלים | 2,560 × 1,920 פיקסלים | 1,000 × 750 פיקסלים.
לקובץ המקורי (קובץ SVG, הגודל המקורי: 1,000 × 750 פיקסלים, גודל הקובץ: 4 ק"ב)
כיתובים
כיתובים
נא להוסיף משפט שמסביר מה הקובץ מייצג
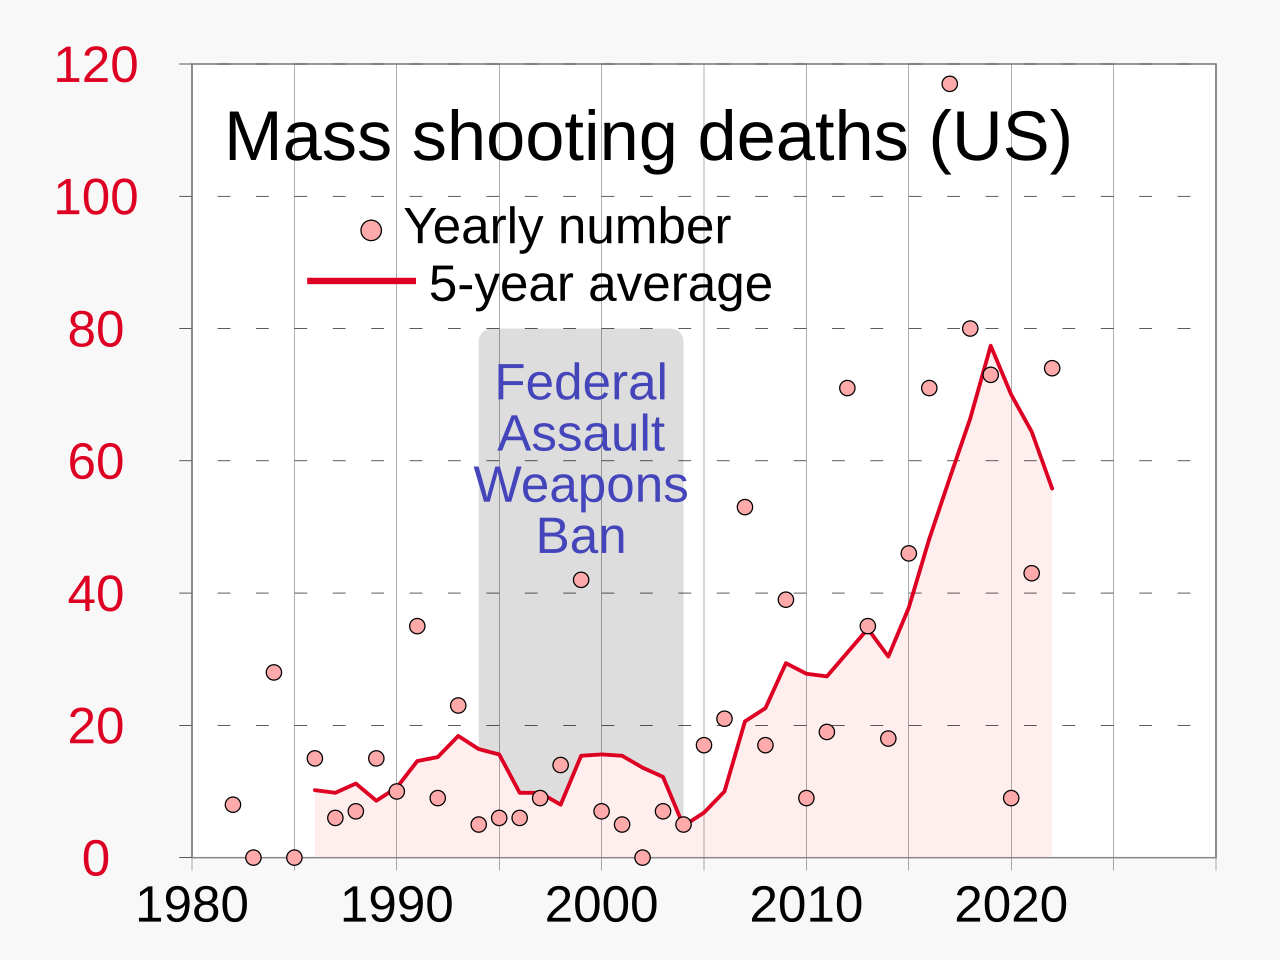
Chart showing deaths from mass shootings in the U.S., including 5-year moving average, beginning in 1982
תקציר[עריכה]
| תיאור |
English: Chart showing deaths from mass shootings in the U.S., including 5-year moving average, beginning in 1982
|
||
| תאריך יצירה | |||
| מקור | נוצר על־ידי מעלה היצירה | ||
| יוצר | RCraig09 |

Related files[עריכה]
-
 Predecessor PNG file
 -
 Predecessor JPG file


רישיון[עריכה]
אני, בעל זכויות היוצרים על עבודה זו, מפרסם בזאת את העבודה תחת הרישיון הבא:
הקובץ הזה מתפרסם לפי תנאי רישיון קריאייטיב קומונז ייחוס-שיתוף זהה 4.0 בין־לאומי.
- הנכם רשאים:
- לשתף – להעתיק, להפיץ ולהעביר את העבודה
- לערבב בין עבודות – להתאים את העבודה
- תחת התנאים הבאים:
- ייחוס – יש לתת ייחוס הולם, לתת קישור לרישיון, ולציין אם נעשו שינויים. אפשר לעשות את זה בכל צורה סבירה, אבל לא בשום צורה שמשתמע ממנה שמעניק הרישיון תומך בך או בשימוש שלך.
- שיתוף זהה – אם תיצרו רמיקס, תשנו, או תבנו על החומר, חובה עליכם להפיץ את התרומות שלך לפי תנאי רישיון זהה או תואם למקור.
היסטוריית הקובץ
ניתן ללחוץ על תאריך/שעה כדי לראות את הקובץ כפי שנראה באותו זמן.
| תאריך/שעה | תמונה ממוזערת | ממדים | משתמש | הערה | |
|---|---|---|---|---|---|
| נוכחית | 04:47, 4 באפריל 2023 | | 750 × 1,000 (4 ק"ב) | RCraig09 (שיחה | תרומות) | Version 3: add to legend |
| 03:46, 2 באפריל 2023 |  | 750 × 1,000 (4 ק"ב) | RCraig09 (שיחה | תרומות) | Version 2: reduce thickness of line trace to be less dominant (compatible with related charts) | |
| 21:43, 31 במרץ 2023 |  | 750 × 1,000 (4 ק"ב) | RCraig09 (שיחה | תרומות) | Uploaded own work with UploadWizard |
אין באפשרותך לדרוס את הקובץ הזה.
שימוש בקובץ
הדפים הבאים משתמשים בקובץ הזה:
- User:RCraig09
- User:Sanandros/ogre/firearms/2023 April 1-10
- User:Sanandros/ogre/firearms/2023 March 21-31
- File:Mass Shooting Deaths by Year.jpg
- File:Mass Shooting Deaths by Year 1994-2017.jpg
- File:Total Deaths in US Mass Shootings 1982-2021.jpg
- File:Total US deaths by year in spree shootings 1982–2018 (ongoing).svg
- File:Total deaths in US mass shootings.png
.svg)
שימוש גלובלי בקובץ
אתרי הוויקי השונים הבאים משתמשים בקובץ זה:
- שימוש באתר cy.wikipedia.org
- שימוש באתר en.wikipedia.org
- שימוש באתר en.wikiquote.org
- שימוש באתר es.wikipedia.org
- שימוש באתר fr.wikipedia.org
- שימוש באתר he.wikipedia.org
- שימוש באתר id.wikipedia.org
- שימוש באתר it.wikipedia.org
- שימוש באתר ja.wikipedia.org
- שימוש באתר pl.wikipedia.org
- שימוש באתר pt.wikipedia.org
- שימוש באתר ru.wikipedia.org
- שימוש באתר vi.wikipedia.org
- שימוש באתר zh.wikipedia.org