File:CAPM-SML.svg
קפיצה לניווט
קפיצה לחיפוש

גודל התצוגה המקדימה הזאת מסוג PNG של קובץ ה־SVG הזה: 723 × 578 פיקסלים. רזולוציות אחרות: 300 × 240 פיקסלים | 601 × 480 פיקסלים | 961 × 768 פיקסלים | 1,280 × 1,023 פיקסלים | 2,560 × 2,047 פיקסלים.
לקובץ המקורי (קובץ SVG, הגודל המקורי: 723 × 578 פיקסלים, גודל הקובץ: 11 ק"ב)
כיתובים
כיתובים
נא להוסיף משפט שמסביר מה הקובץ מייצג
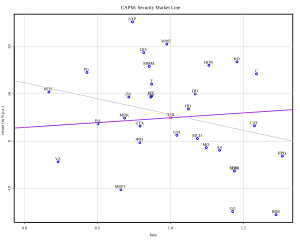
| תיאור | dow jones index and it's 30 stocks: the CAPM and the security market line (purple). the grey line is the linear model. mean yield is assumed to be 2.9% |
| תאריך יצירה | |
| מקור | data by quote.yahoo, atomatically retrieved with GNU R, see graph source below |
| יוצר | Thomas Steiner |
| אישורים והיתרים (שימוש חוזר בקובץ זה) |
Thomas Steiner put it under the CC-by-SA 2.5. |
הקובץ הזה מתפרסם לפי תנאי רישיון קריאייטיב קומונז ייחוס-שיתוף זהה 2.5 כללי.
- הנכם רשאים:
- לשתף – להעתיק, להפיץ ולהעביר את העבודה
- לערבב בין עבודות – להתאים את העבודה
- תחת התנאים הבאים:
- ייחוס – יש לתת ייחוס הולם, לתת קישור לרישיון, ולציין אם נעשו שינויים. אפשר לעשות את זה בכל צורה סבירה, אבל לא בשום צורה שמשתמע ממנה שמעניק הרישיון תומך בך או בשימוש שלך.
- שיתוף זהה – אם תיצרו רמיקס, תשנו, או תבנו על החומר, חובה עליכם להפיץ את התרומות שלך לפי תנאי רישיון זהה או תואם למקור.
R source:
library(tseries)
library(RSvgDevice)

quote<-function(inst, nDs) {
  if(!inherits(try(open(url("http://quote.yahoo.com")), silent = TRUE), "try-error")) {
    start <- strftime(as.POSIXlt(Sys.time() - nDs*24*3600), format="%Y-%m-%d")
    end <- strftime(as.POSIXlt(Sys.time()), format = "%Y-%m-%d")
    x <- get.hist.quote(instrument=inst, start=start, end=end, quote = c("AdjClose"), compression="m",  quiet=T, retclass="zoo")
  }
  return(x)
}

yield=2.9
nDays=1042
comp<-c("^DJI", "AA", "AIG", "AXP", "BA", "C", "CAT", "DD", "DIS", "GE", "GM", "HD", "HON", "HPQ", "IBM", "INTC", "JNJ", "JPM", "KO", "MCD", "MMM", "MO", "MRK", "MSFT", "PFE", "PG", "T", "UTX", "VZ", "WMT", "XOM")

comp.quote<-quote(comp[1],nDays)
from= as.Date(index(comp.quote[1,1]),format="%Y-%m-%d")
to=   as.Date(index(comp.quote[length(comp.quote[,1]),1]),format="%Y-%m-%d")

for (c in 2:length(comp)) {
  comp.quote<-merge(comp.quote,quote(comp[c],nDays))
}

rdt<-12*diff(comp.quote)/comp.quote*100

points=array(NA,dim=c(length(comp),2))
for (p in 1:length(comp)) {
  points[p,1]= cov(rdt[,1],rdt[,p])/var(rdt[,1])
  points[p,2]=mean(rdt[,p])
}

devSVG(file="CAPM-SML.svg", width=10, height=8, bg="transparent", fg="black", onefile=TRUE, xmlHeader=TRUE)

par(lwd=2)
plot(points[2:length(comp),],type="p",col="blue",xlab="beta",ylab="return (in % p.a.)",main="CAPM: Security Market Line",xlim=range(0,points[,1]))
lines(points[1,1],points[1,2],col="red",type="p")
abline(a=yield,b=points[1,2]-yield,col="purple")
text(points[2:length(comp),1],points[2:length(comp),2],comp,pos=3,col="blue")
text(points[1,1],             points[1,2],           comp[1],pos=3,col="red")

lm1<-lm(points[,2]~points[,1])
abline(lm1,col="darkgrey",lwd=1)

text(x=par("usr")[2], y=par("usr")[3]+0.5, labels=paste("Dow Jones monthly data from", format.Date(from,"%d %b %Y"), "to", format.Date(to,"%d %b %Y"),""), col="grey",adj=c(1,0) )
grid(lwd=1)

dev.off()
. R עם נוצרה ה תמונה
היסטוריית הקובץ
ניתן ללחוץ על תאריך/שעה כדי לראות את הקובץ כפי שנראה באותו זמן.
| תאריך/שעה | תמונה ממוזערת | ממדים | משתמש | הערה | |
|---|---|---|---|---|---|
| נוכחית | 14:08, 8 בנובמבר 2006 | | 578 × 723 (11 ק"ב) | Thire (שיחה | תרומות) | {{Information| |Description = dow jones index and it's 30 stocks: the CAPM and the security market line (purple). the grey line is the linear model. mean yield is assumed to be 2.9% |Source = data by quote.yahoo, atomatically retrieved with GNU R, see gra |
אין באפשרותך לדרוס את הקובץ הזה.
שימוש בקובץ
אין דפים המשתמשים בקובץ זה.
שימוש גלובלי בקובץ
אתרי הוויקי השונים הבאים משתמשים בקובץ זה:
- שימוש באתר de.wikibooks.org
- שימוש באתר en.wikipedia.org
- שימוש באתר en.wikibooks.org
- שימוש באתר fa.wikipedia.org
- שימוש באתר he.wikipedia.org
- שימוש באתר he.wiktionary.org
- שימוש באתר hi.wikipedia.org
- שימוש באתר hy.wikipedia.org
- שימוש באתר nl.wikipedia.org
- שימוש באתר pt.wikipedia.org
- שימוש באתר ru.wikipedia.org