File:Csv-bivariate-normal-distribution.svg
קפיצה לניווט
קפיצה לחיפוש

גודל התצוגה המקדימה הזאת מסוג PNG של קובץ ה־SVG הזה: 296 × 599 פיקסלים. רזולוציות אחרות: 118 × 240 פיקסלים | 237 × 480 פיקסלים | 379 × 768 פיקסלים | 506 × 1,024 פיקסלים | 1,012 × 2,048 פיקסלים | 640 × 1,295 פיקסלים.
לקובץ המקורי (קובץ SVG, הגודל המקורי: 640 × 1,295 פיקסלים, גודל הקובץ: 2.65 מ"ב)
כיתובים
כיתובים
נא להוסיף משפט שמסביר מה הקובץ מייצג
תקציר
[עריכה]
| תיאור |
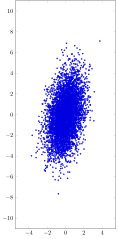
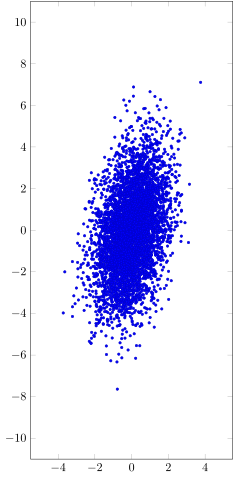
English: 5000 samples of a bivariate normal distribution with variances 1 and 4 and rho=0.7
Deutsch: 5000 Datenpunkte einer Bivariaten Normalverteilung mit der Kovarianzmatrix 1.0, 0.7, [0.7, 4.0] und dem mittelwertsvektor [0.0, 0.0] |
| תאריך יצירה | |
| מקור | נוצר על־ידי מעלה היצירה |
| יוצר | MartinThoma |
W3C-validity not checked.
Source is available at github
#!/usr/bin/env python
# -*- coding: utf-8 -*-

"""Create samples for bivariate distribution."""

from numpy.random import multivariate_normal, seed


def create_data(n):
    means = [0.0, 0.0]
    cov = [[1.0, 0.7], [0.7, 4.0]]
    seed(0)
    samples = multivariate_normal(means, cov, n)
    with open("data.csv", "w") as f:
        f.write("x,y\n")
        for datapoint in samples:
            f.write("%0.4f,%0.4f\n" % tuple(datapoint))


def get_parser():
    from argparse import ArgumentParser, ArgumentDefaultsHelpFormatter
    parser = ArgumentParser(description=__doc__,
                            formatter_class=ArgumentDefaultsHelpFormatter)
    parser.add_argument("-n",
                        dest="n",
                        default=5000,
                        type=int,
                        help="Number of points to generate")
    return parser


if __name__ == "__main__":
    args = get_parser().parse_args()
    create_data(args.n)
\documentclass[varwidth=true, border=2pt]{standalone}
\usepackage[utf8]{inputenc} % this is needed for umlauts
\usepackage[ngerman]{babel} % this is needed for umlauts
\usepackage[T1]{fontenc}    % this is needed for correct output of umlauts in pdf
\usepackage[margin=2.5cm]{geometry} %layout

\usepackage{pgfplots}
\pgfplotsset{compat=newest}
\usetikzlibrary{plotmarks}

\begin{document}
\tikzset{mark options={line width=0.5pt}}
\begin{tikzpicture}
    \begin{axis}[
            width=7.5cm, height=15cm,     % size of the image
            enlarge x limits=0.05,
            enlarge y limits=0.05,
            xmin = -5,
            xmax = 5,
            ymin = -10,
            ymax = 10,
            % xlabel=x,
            % ylabel=y
         ]
          \addplot[scatter,
                   only marks,
                   mark=*,
                   mark size = 1,
                   point meta=1,
                   ]
                   table [x=x, y=y, col sep=comma] {data.csv};
    \end{axis}
\end{tikzpicture}
\end{document}
רישיון
[עריכה]
אני, בעל זכויות היוצרים על עבודה זו, מפרסם בזאת את העבודה תחת הרישיון הבא:
| קובץ זה זמין לפי תנאי הקדשה עולמית לנחלת הכלל CC0 1.0 של Creative Commons. | |
| האדם ששייך יצירה להיתר הזה הקדיש את היצירה לנחלת הכלל על־ידי ויתור על כל הזכויות שלו או שלה על היצירה בכל העולם לפי חוק זכויות יוצרים, לרבות כל הזכויות הקשורות או הסמוכות כקבוע בחוק. באפשרותך להעתיק, לשנות, להפיץ, או להציג את היצירה, אפילו למטרות מסחריות, וכל זה אפילו מבלי לבקש רשות.
|
היסטוריית הקובץ
ניתן ללחוץ על תאריך/שעה כדי לראות את הקובץ כפי שנראה באותו זמן.
| תאריך/שעה | תמונה ממוזערת | ממדים | משתמש | הערה | |
|---|---|---|---|---|---|
| נוכחית | 14:52, 8 בספטמבר 2015 | | 1,295 × 640 (2.65 מ"ב) | MartinThoma (שיחה | תרומות) | {{Information |Description ={{en|1=5000 samples of a bivariate normal distribution with variances 1 and 4 and rho=0.7}} {{de|1=5000 Datenpunkte einer Bivariaten Normalverteilung mit der Kovarianzmatrix 1.0, 0.7, [0.7, 4.0] und dem mittelwertsvek... |
אין באפשרותך לדרוס את הקובץ הזה.
שימוש בקובץ
הדף הבא משתמש בקובץ הזה:
שימוש גלובלי בקובץ
אתרי הוויקי השונים הבאים משתמשים בקובץ זה: