File:DT fusion rxnrate.svg
둘러보기로 이동
검색으로 이동

SVG 파일의 PNG 형식의 미리보기 크기: 360 × 324 픽셀. 다른 해상도: 267 × 240 픽셀 | 533 × 480 픽셀 | 853 × 768 픽셀 | 1,138 × 1,024 픽셀 | 2,276 × 2,048 픽셀
원본 파일 (SVG 파일, 실제 크기 360 × 324 픽셀, 파일 크기: 12 KB)
캡션
설명
이 파일이 나타내는 바에 대한 한 줄 설명을 추가합니다
파일 설명
[편집]
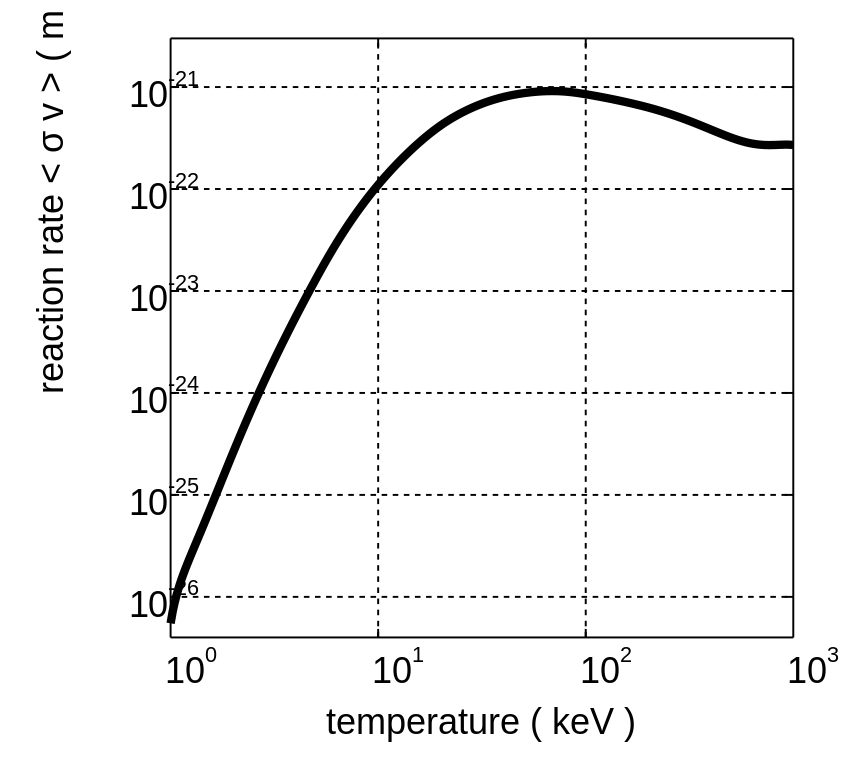
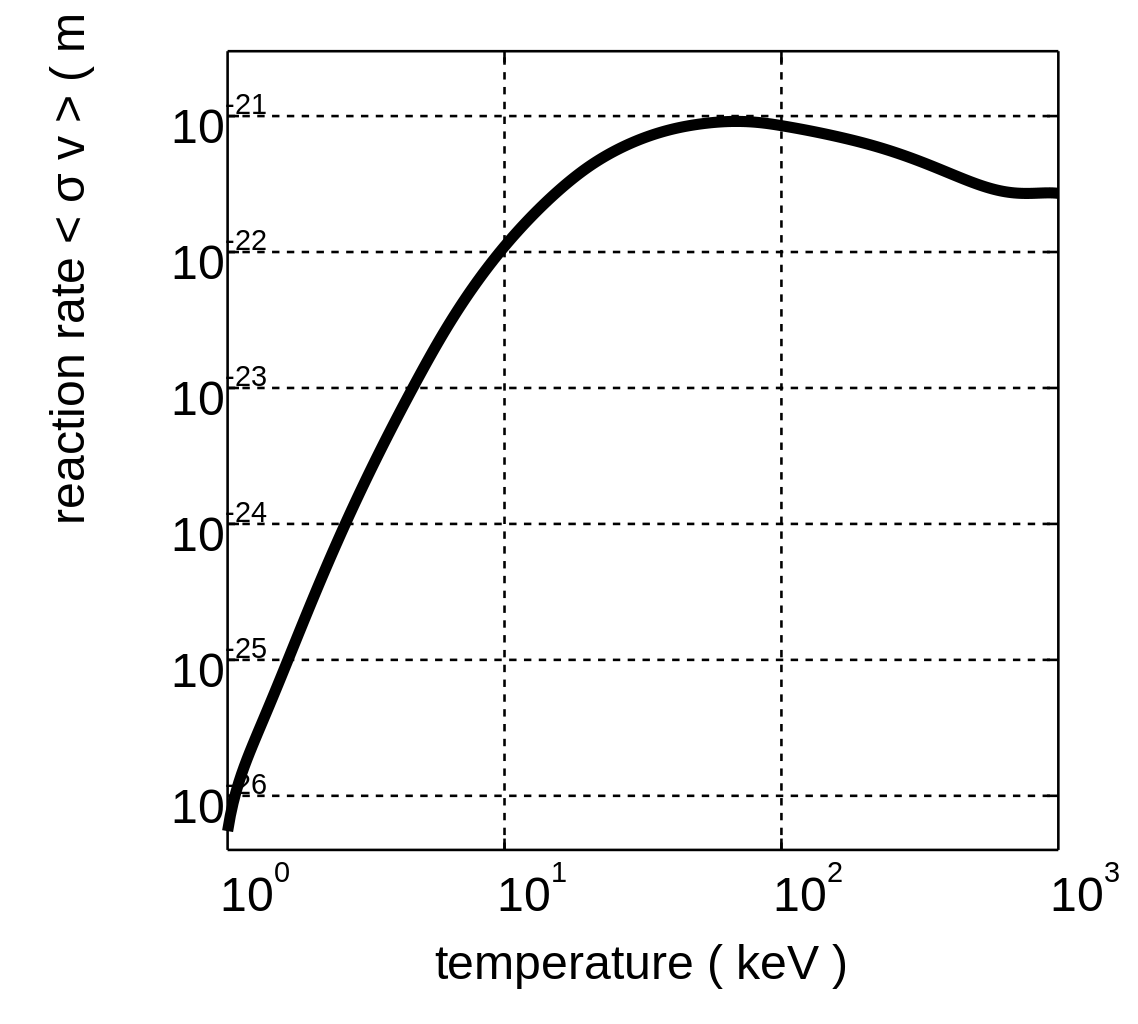
Logarithmic plot of the deuteron-triton fusion reaction rate <σv>, for Maxwellian ion velocity distributions with the same temperature. Created on 10 December 2005 by David Strozzi using Matlab. The curve is a spline interpolation through the data points included on p. 45 of the 2000 revision of the "NRL Plasma Formulary."
라이선스
[편집]
이 파일은 크리에이티브 커먼즈 저작자표시-동일조건변경허락 2.5 일반 라이선스로 배포됩니다.
- 이용자는 다음의 권리를 갖습니다:
- 공유 및 이용 – 저작물의 복제, 배포, 전시, 공연 및 공중송신
- 재창작 – 저작물의 개작, 수정, 2차적저작물 창작
- 다음과 같은 조건을 따라야 합니다:
- 저작자표시 – 적절한 저작자 표시를 제공하고, 라이센스에 대한 링크를 제공하고, 변경사항이 있는지를 표시해야 합니다. 당신은 합리적인 방식으로 표시할 수 있지만, 어떤 방식으로든 사용권 허가자가 당신 또는 당신의 사용을 지지하는 방식으로 표시할 수 없습니다.
- 동일조건변경허락 – 만약 당신이 이 저작물을 리믹스 또는 변형하거나 이 저작물을 기반으로 제작하는 경우, 당신은 당신의 기여물을 원저작물과 동일하거나 호환 가능한 라이선스에 따라 배포하여야 합니다.
파일 역사
날짜/시간 링크를 클릭하면 해당 시간의 파일을 볼 수 있습니다.
| 날짜/시간 | 섬네일 | 크기 | 사용자 | 설명 | |
|---|---|---|---|---|---|
| 현재 | 2005년 12월 12일 (월) 00:15 | | 360 × 324 (12 KB) | Dstrozzi~commonswiki (토론 | 기여) | Logarithmic plot of the deuteron-triton fusion reaction rate <σv>, for Maxwellian ion velocity distributions with the same temperature. Created on 11 December 2005 by David Strozzi using Matlab. The curve is a spline interpolation through the data |
| 2005년 12월 10일 (토) 22:01 |  | 270 × 234 (12 KB) | Dstrozzi~commonswiki (토론 | 기여) | Logarithmic plot of the deuteron-triton fusion reaction rate <σv>, for Maxwellian ion velocity distributions with the same temperature. Created on 10 December 2005 by David Strozzi using Matlab. The curve is a spline interpolation through the data | |
| 2005년 12월 10일 (토) 20:19 | 270 × 3 (12 KB) | Dstrozzi~commonswiki (토론 | 기여) | Logarithmic plot of the deuteron-triton fusion reaction rate <σv>, for Maxwellian ion velocity distributions with the same temperature. Created on 10 December 2005 by David Strozzi using Matlab. The curve is a spline interpolation through the data | ||
| 2005년 12월 10일 (토) 19:52 | 270 × 3 (12 KB) | Dstrozzi~commonswiki (토론 | 기여) | Logarithmic plot of the deuteron-triton fusion reaction rate <σv>, for Maxwellian ion velocity distributions with the same temperature. Created on 10 December 2005 by David Strozzi using Matlab. The curve is a spline interpolation through the data | ||
| 2005년 12월 10일 (토) 07:24 |  | 512 × 333 (12 KB) | Dstrozzi~commonswiki (토론 | 기여) | Logarithmic plot of the deuteron-triton fusion reaction rate <v>, for Maxwellian ion velocity distributions with the same temperature. Created on 9 December 2005 by David Strozzi using Matlab. The curve is a spline interpolation through the data points i |
이 파일을 덮어쓸 수 없습니다.
이 파일을 사용하는 문서
다음 문서 1개가 이 파일을 사용하고 있습니다:
이 파일을 사용하고 있는 모든 위키의 문서 목록
다음 위키에서 이 파일을 사용하고 있습니다:
- bs.wikipedia.org에서 이 파일을 사용하고 있는 문서 목록
- eo.wikipedia.org에서 이 파일을 사용하고 있는 문서 목록
- es.wikipedia.org에서 이 파일을 사용하고 있는 문서 목록
- fr.wikibooks.org에서 이 파일을 사용하고 있는 문서 목록
- hr.wikipedia.org에서 이 파일을 사용하고 있는 문서 목록
- ko.wikipedia.org에서 이 파일을 사용하고 있는 문서 목록
- no.wikipedia.org에서 이 파일을 사용하고 있는 문서 목록
- pt.wikipedia.org에서 이 파일을 사용하고 있는 문서 목록
- sh.wikipedia.org에서 이 파일을 사용하고 있는 문서 목록
- sr.wikipedia.org에서 이 파일을 사용하고 있는 문서 목록