File:Epicycloid2 vectorial.svg
קפיצה לניווט
קפיצה לחיפוש

גודל התצוגה המקדימה הזאת מסוג PNG של קובץ ה־SVG הזה: 720 × 540 פיקסלים. רזולוציות אחרות: 320 × 240 פיקסלים | 640 × 480 פיקסלים | 1,024 × 768 פיקסלים | 1,280 × 960 פיקסלים | 2,560 × 1,920 פיקסלים.
לקובץ המקורי (קובץ SVG, הגודל המקורי: 720 × 540 פיקסלים, גודל הקובץ: 297 ק"ב)
כיתובים
כיתובים
נא להוסיף משפט שמסביר מה הקובץ מייצג
תקציר
[עריכה]
| תיאור |
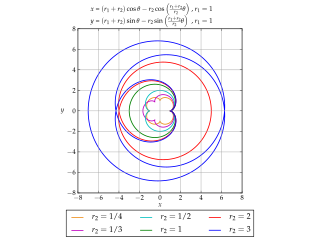
English: Set of epicycloidal curves |
| תאריך יצירה | |
| מקור | נוצר על־ידי מעלה היצירה |
| יוצר | Guillaume Jacquenot |
| SVGהתפתחות | Matplotlib עם נוצרה ה W3C-לא תקין גרפיקה וקטורית |
| קוד מקור | Python code# -*- coding: utf-8 -*-
#
# Script to generate a set of epicycloidal curve.
#
# Guillaume Jacquenot
# 2013 03 20
import numpy as np
import matplotlib
from matplotlib.pyplot import figure, show, rc, grid, legend
def epicycloid(r1=1,r2=1, theta = np.arange(0.0,2*np.pi,0.005)):
x = (r1+r2)*np.cos(theta)-r2*np.cos((r1+r2)/r2*theta)
y = (r1+r2)*np.sin(theta)-r2*np.sin((r1+r2)/r2*theta)
return x,y
def makePlot(outputFilename = r'Epicycloid2_vectorial.svg'):
rc('grid', linewidth = 0.75, linestyle = '-', color = '#a0a0a0')
rc('xtick', labelsize = 12)
rc('ytick', labelsize = 12)
rc('font',**{'family':'serif','serif':['Palatino'],'size':12})
rc('text', usetex=True)
fig = figure()
ax = fig.add_axes([0.12, 0.12, 0.76, 0.76])#axisbg='#d5de9c'
x,y = epicycloid(r2=1.0/4.0)
ax.plot(x, y, color='#ee8d18', lw = 1.5, label=r'$r_2=1/4$')
x,y = epicycloid(r2=1.0/3.0)
ax.plot(x, y, color='m', lw = 1.5, label=r'$r_2=1/3$')
x,y = epicycloid(r2=1.0/2.0)
ax.plot(x, y, color='c', lw = 1.5, label=r'$r_2=1/2$')
x,y = epicycloid(r2=1.0)
ax.plot(x, y, color='g', lw = 1.5, label=r'$r_2=1$')
x,y = epicycloid(r2=2.0, theta = np.arange(0.0,4*np.pi,0.005))
ax.plot(x, y, color='r', lw = 1.5, label=r'$r_2=2$')
x,y = epicycloid(r2=3.0, theta = np.arange(0.0,6*np.pi,0.005))
ax.plot(x, y, color='b', lw = 1.5, label=r'$r_2=3$')
ax.set_aspect('equal')
grid(True)
box = ax.get_position()
ax.set_position([box.x0, box.y0 + box.height * 0.1,
box.width, box.height * 0.9])
ax.legend(loc='upper center', bbox_to_anchor=(0.5, -0.08),
ncol=3)
ax.set_xlabel('$x$')
ax.set_ylabel('$y$',rotation=0)
ax.set_title(r'\begin{tabular}{lcll}'+\
r'$x$ &=&$(r_1+r_2) \cos\theta - r_2 \cos\left(\frac{r_1+r_2}{r_2}\theta\right)$&, $r_1=1$\\'+\
r'$y$ &=&$(r_1+r_2) \sin\theta - r_2 \sin\left(\frac{r_1+r_2}{r_2}\theta\right)$&, $r_1=1$'+\
r'\end{tabular}',
fontsize=12)
fig.savefig(outputFilename)
fig.show()
makePlot()
|
רישיון
[עריכה]
אני, בעל זכויות היוצרים על עבודה זו, מפרסם בזאת את העבודה תחת הרישיון הבא:
הקובץ הזה מתפרסם לפי תנאי רישיון קריאייטיב קומונז ייחוס-שיתוף זהה 3.0 לא מותאם.
- הנכם רשאים:
- לשתף – להעתיק, להפיץ ולהעביר את העבודה
- לערבב בין עבודות – להתאים את העבודה
- תחת התנאים הבאים:
- ייחוס – יש לתת ייחוס הולם, לתת קישור לרישיון, ולציין אם נעשו שינויים. אפשר לעשות את זה בכל צורה סבירה, אבל לא בשום צורה שמשתמע ממנה שמעניק הרישיון תומך בך או בשימוש שלך.
- שיתוף זהה – אם תיצרו רמיקס, תשנו, או תבנו על החומר, חובה עליכם להפיץ את התרומות שלך לפי תנאי רישיון זהה או תואם למקור.
היסטוריית הקובץ
ניתן ללחוץ על תאריך/שעה כדי לראות את הקובץ כפי שנראה באותו זמן.
| תאריך/שעה | תמונה ממוזערת | ממדים | משתמש | הערה | |
|---|---|---|---|---|---|
| נוכחית | 16:37, 23 במרץ 2013 | | 540 × 720 (297 ק"ב) | Gjacquenot (שיחה | תרומות) | User created page with UploadWizard |
אין באפשרותך לדרוס את הקובץ הזה.
שימוש בקובץ
הדף הבא משתמש בקובץ הזה: