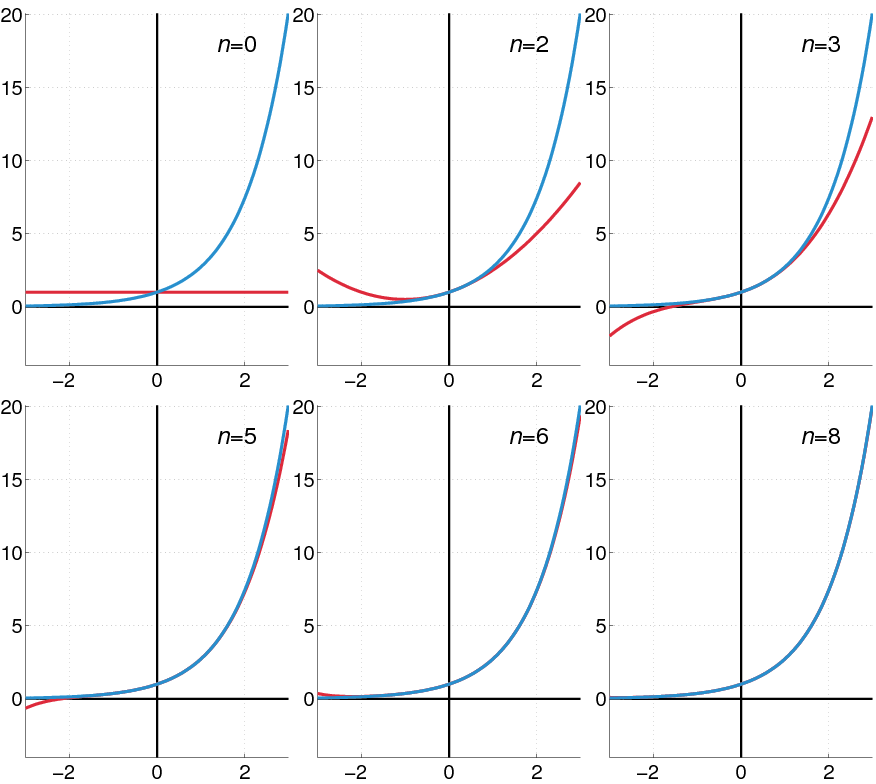
File:Exp series.gif
מתוך Wikimedia Commons
קפיצה לניווט
קפיצה לחיפוש
Exp_series.gif (292 × 392 פיקסלים, גודל הקובץ: 51 ק"ב, סוג MIME: image/gif, בלולאה, 9 תמונות, 9.0 שניות)
מידע על הקובץ
נתונים מובְנים
כיתובים
כיתובים
נא להוסיף משפט שמסביר מה הקובץ מייצג
| תיאורExp series.gif |
English: Illustration of the en:Exponential function العربية: الرسم البياني للدالة الأسية |
| תאריך יצירה | Oleg Alexandrov 03:11, 30 August 2007 (UTC) |
| מקור | self-made with MATLAB. |
| יוצר | Oleg Alexandrov |
. MATLAB עם נוצרה ה GIF תמונת מפת סיביות
| Public domainPublic domainfalsefalse |
| ברצוני, בעלי זכויות היוצרים על יצירה זו, לשחרר יצירה זו לנחלת הכלל. זה תקף בכל העולם. יש מדינות שבהן הדבר אינו אפשרי על פי חוק, אם כך: אני מעניק לכל אחד את הזכות להשתמש בעבודה זו לכל מטרה שהיא, ללא תנאים כלשהם, אלא אם כן תנאים כאלה נדרשים על פי חוק. |
MATLAB source code
[עריכה]% The exponential function as the sum of its Taylor series
function main()
% KSmrq's colors
red = [0.867 0.06 0.14];
blue = [0, 129, 205]/256;
green = [0, 200, 70]/256;
yellow = [254, 194, 0]/256;
white = 0.99*[1, 1, 3];
% Set up the grid and other parameters
N = 100;
A = -3; B = 3;
X = linspace(A, B, N);
Y = exp(X);
D = max(Y); C = -0.2*D;
% plot the frames
Sum = 0*X; Term = 0*X+1;
num_frames = 8;
for j=0:num_frames
Sum = Sum+Term;
Term = Term.*X/(j+1);
% Set up the figure
lw = 3; % linewidth
fs = 20; % font size
figure(1); clf; set(gca, 'fontsize', fs);
hold on; grid on;
set(gca, 'DataAspectRatio', [1 3 1]); % aspect ratio
plot_axes (A, B, C, D, lw/1.3);
plot(X, Sum, 'color', blue, 'linewidth', lw);
plot(X, Y, 'color', red, 'linewidth', lw);
axis([A, B, C, D]);
text_str = sprintf('{\\it n}=%d', j)
H= text (1.2, 18, text_str, 'fontsize', floor(1.2*fs))
frame=sprintf('Frame%d.eps', 1000+j);
disp(frame)
saveas(gcf, frame, 'psc2');
end
% Convert to animation with the command
% convert -antialias -loop 10000 -delay 100 -compress LZW Frame100* Exp_series.gif
function plot_axes (A, B, C, D, lw)
black = [0, 0, 0];
plot([A B], [0, 0], 'linewidth', lw, 'color', black);
plot([0, 0], [C, D], 'linewidth', lw, 'color', black);
היסטוריית הקובץ
ניתן ללחוץ על תאריך/שעה כדי לראות את הקובץ כפי שנראה באותו זמן.
| תאריך/שעה | תמונה ממוזערת | ממדים | משתמש | הערה | |
|---|---|---|---|---|---|
| נוכחית | 03:21, 30 באוגוסט 2007 |  | 392 × 292 (51 ק"ב) | Oleg Alexandrov (שיחה | תרומות) | tweak |
| 03:20, 30 באוגוסט 2007 |  | 391 × 291 (50 ק"ב) | Oleg Alexandrov (שיחה | תרומות) | tweak | |
| 03:11, 30 באוגוסט 2007 |  | 386 × 289 (49 ק"ב) | Oleg Alexandrov (שיחה | תרומות) | {{Information |Description=Illustration of the en:Exponential function |Source=self-made with MATLAB. |Date=~~~~ |Author= Oleg Alexandrov }} Category:Calculus Category:Files by User:Oleg Alexandrov from en.wikipedia |
אין באפשרותך לדרוס את הקובץ הזה.
שימוש בקובץ
אין דפים המשתמשים בקובץ זה.
שימוש גלובלי בקובץ
אתרי הוויקי השונים הבאים משתמשים בקובץ זה:
- שימוש באתר ar.wikipedia.org
- שימוש באתר ast.wikipedia.org
- שימוש באתר az.wikipedia.org
- שימוש באתר be.wikipedia.org
- שימוש באתר bg.wikipedia.org
- שימוש באתר bn.wikipedia.org
- שימוש באתר bs.wikipedia.org
- שימוש באתר ca.wikipedia.org
- שימוש באתר ckb.wikipedia.org
- שימוש באתר cs.wikipedia.org
- שימוש באתר cv.wikipedia.org
- שימוש באתר de.wikipedia.org
- שימוש באתר de.wikiversity.org
- Kurs:Mathematik (Osnabrück 2009-2011)/Teil I/Vorlesung 26
- Kurs:Analysis (Osnabrück 2013-2015)/Teil I/Vorlesung 16
- Kurs:Analysis (Osnabrück 2014-2016)/Teil I/Vorlesung 16
- Kurs:Analysis (Osnabrück 2014-2016)/Teil I/Vorlesung 16/kontrolle
- Kurs:Analysis (Osnabrück 2021-2023)/Teil I/Vorlesung 16
- Kurs:Analysis (Osnabrück 2021-2023)/Teil I/Vorlesung 16/kontrolle
- Kurs:Analysis (Osnabrück 2013-2015)/Teil I/Vorlesung 16/kontrolle
- Kurs:Funktionentheorie (Osnabrück 2023-2024)/Vorlesung 7
- Kurs:Funktionentheorie (Osnabrück 2023-2024)/Vorlesung 7/kontrolle
- Taylorreihe
- שימוש באתר el.wikipedia.org
- שימוש באתר en.wikipedia.org
- שימוש באתר en.wikiversity.org
- שימוש באתר eo.wikipedia.org
- שימוש באתר es.wikipedia.org
- שימוש באתר eu.wikipedia.org
צפייה בשימושים גלובליים נוספים של קובץ זה.
