File:Hong Kong Population.svg
둘러보기로 이동
검색으로 이동

SVG 파일의 PNG 형식의 미리보기 크기: 750 × 450 픽셀. 다른 해상도: 320 × 192 픽셀 | 640 × 384 픽셀 | 1,024 × 614 픽셀 | 1,280 × 768 픽셀 | 2,560 × 1,536 픽셀
원본 파일 (SVG 파일, 실제 크기 750 × 450 픽셀, 파일 크기: 10 KB)
캡션
설명
이 파일이 나타내는 바에 대한 한 줄 설명을 추가합니다
파일 설명[편집]
| 설명 |
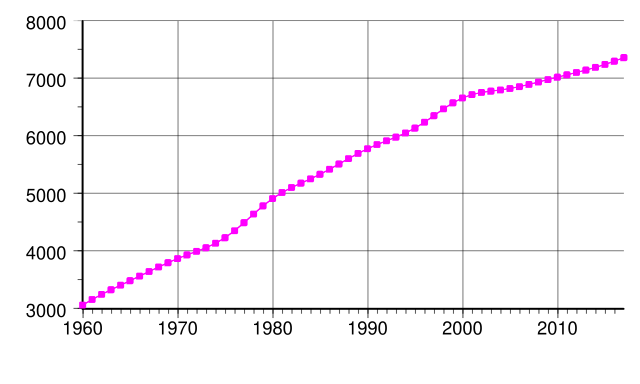
English: Graph showing the population of Hong Kong. Population in thousands. From UN estimates, World Population Prospects: The 2017 Revision |
| 날짜 | (UTC) |
| 출처 | 자작 |
| 저자 | Wylve |
Generated with Wikimedia SVG Chart[편집]
| Data format | The source data of the chart is in the SVG image file in a clearly readable format. You see the original numbers inside of the SVG file in the form of a list such as this:
... 1995 10.06 1996 11.75 1997 12.45 ... |
| Content of SVG | To view the data download the SVG file itself. To do so right-click this link, and then choose the option to save: File:Hong Kong Population.svg. Launch any text editor. Open the downloaded SVG file with the text editor (usually; file menu, open). To see the list of data, search for the phrase id="graph1". |
| Please, do not use a special SVG editor such as Inkscape; the readability of the database would be destroyed. You can edit the SVG file with any text editor, for example; en: List of text editors. You can view the edited SVG file in various web browsers. As of 2011, all major desktop browsers, and many minor ones, have some level of SVG support. See: en: Scalable Vector Graphics#Support for SVG in web browsers. When satisfied with your edits, upload the edited SVG file with the link labeled "Upload a new version of this file".
W3C-validity not checked. This chart was created with Wikimedia SVG Chart. 이 SVG 파일은 내장된 문자열을 사용하고 있으며, 숫자만을 사용하고 있습니다. |
|
| Code to generate SVG | See: File talk:Hong Kong Population.svg. Documentation see: Wikimedia SVG Chart. |
라이선스[편집]
| 나는 이 작품의 저작권자로서, 이 작품을 퍼블릭 도메인으로 모두에게 공개합니다. 이 공개 선언은 전 세계적으로 유효합니다. 만약 저작권의 포기가 법률적으로 가능하지 않은 경우, 나는 이 작품을 법적으로 허용되는 한도 내에서 누구나 자유롭게 어떤 목적으로도 제한없이 사용할 수 있도록 허용합니다. |
파일 역사
날짜/시간 링크를 클릭하면 해당 시간의 파일을 볼 수 있습니다.
| 날짜/시간 | 섬네일 | 크기 | 사용자 | 설명 | |
|---|---|---|---|---|---|
| 현재 | 2017년 11월 4일 (토) 22:56 | | 750 × 450 (10 KB) | Delphi234 (토론 | 기여) | 2017 |
| 2017년 11월 4일 (토) 17:52 |  | 670 × 360 (5 KB) | Delphi234 (토론 | 기여) | remove fill | |
| 2012년 7월 9일 (월) 12:37 |  | 670 × 360 (5 KB) | Wylve (토론 | 기여) | workaround fill issue | |
| 2012년 7월 9일 (월) 12:06 |  | 670 × 360 (5 KB) | Wylve (토론 | 기여) | fix fill | |
| 2012년 7월 9일 (월) 12:03 |  | 670 × 360 (5 KB) | Wylve (토론 | 기여) | Add more data points and change graph type | |
| 2012년 7월 9일 (월) 09:00 |  | 670 × 360 (5 KB) | Wylve (토론 | 기여) | == {{int:filedesc}} == {{Information |Description={{en|Graph showing the population of Hong Kong.}} |Source= |Date=2012-07-09 08:55 (UTC) |Author= |Permission= |other_versions= }} == {{int:license}} == {{self|PD-user-w}} Category:Demography |
이 파일을 덮어쓸 수 없습니다.
이 파일을 사용하는 문서
다음 문서 1개가 이 파일을 사용하고 있습니다:
- File:Hong Kong Population Graph.svg (파일 넘겨주기)
이 파일을 사용하고 있는 모든 위키의 문서 목록
다음 위키에서 이 파일을 사용하고 있습니다:
- de.wikipedia.org에서 이 파일을 사용하고 있는 문서 목록
- en.wikipedia.org에서 이 파일을 사용하고 있는 문서 목록
- ja.wikipedia.org에서 이 파일을 사용하고 있는 문서 목록
- ko.wikipedia.org에서 이 파일을 사용하고 있는 문서 목록
- ru.wikipedia.org에서 이 파일을 사용하고 있는 문서 목록
- uk.wikipedia.org에서 이 파일을 사용하고 있는 문서 목록
- vi.wikibooks.org에서 이 파일을 사용하고 있는 문서 목록