File:Julsrud 2022 dimming.jpg
קפיצה לניווט
קפיצה לחיפוש

גודל התצוגה המקדימה הזאת: 706 × 600 פיקסלים. רזולוציות אחרות: 283 × 240 פיקסלים | 565 × 480 פיקסלים | 905 × 768 פיקסלים | 1,206 × 1,024 פיקסלים | 2,128 × 1,807 פיקסלים.
לקובץ המקורי (2,128 × 1,807 פיקסלים, גודל הקובץ: 522 ק"ב, סוג MIME: image/jpeg)
כיתובים
כיתובים
נא להוסיף משפט שמסביר מה הקובץ מייצג
תקציר
[עריכה]
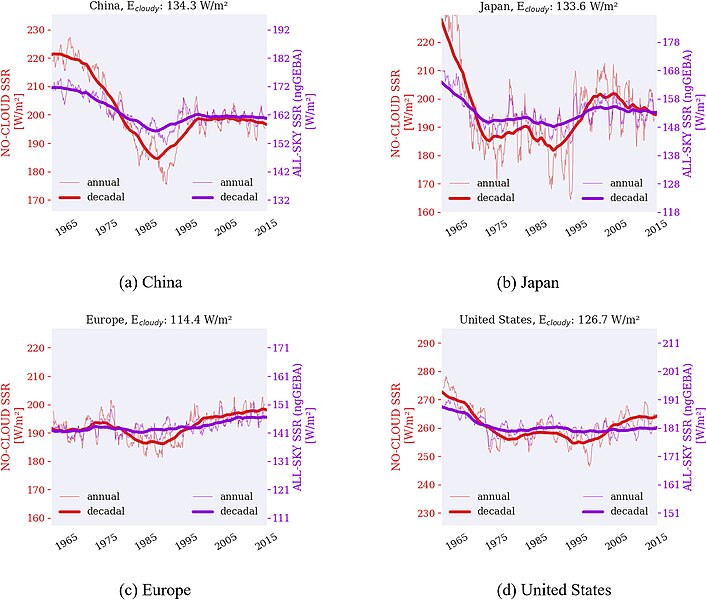
This scientific graphic from Julsrud et al., 2022 shows the observed trends of w:global dimming and brightening in four major geopolitical regions. It also demonstrates that the difference had nothing to do with w:cloud cover trends, as the dimming is greater on the average cloud-free days (red line) than on the average of all days (purple line).
רישיון
[עריכה]
הקובץ הזה מתפרסם לפי תנאי רישיון קריאייטיב קומונז ייחוס 4.0 בין־לאומי.
- הנכם רשאים:
- לשתף – להעתיק, להפיץ ולהעביר את העבודה
- לערבב בין עבודות – להתאים את העבודה
- תחת התנאים הבאים:
- ייחוס – יש לתת ייחוס הולם, לתת קישור לרישיון, ולציין אם נעשו שינויים. אפשר לעשות את זה בכל צורה סבירה, אבל לא בשום צורה שמשתמע ממנה שמעניק הרישיון תומך בך או בשימוש שלך.
היסטוריית הקובץ
ניתן ללחוץ על תאריך/שעה כדי לראות את הקובץ כפי שנראה באותו זמן.
| תאריך/שעה | תמונה ממוזערת | ממדים | משתמש | הערה | |
|---|---|---|---|---|---|
| נוכחית | 10:53, 17 בדצמבר 2023 | | 1,807 × 2,128 (522 ק"ב) | InformationToKnowledge (שיחה | תרומות) | This scientific graphic from [Julsrud et al., 2022] shows the observed trends of global dimming and brightening in four major geopolitical regions. It also demonstrates that the difference had nothing to do with cloud cover trends, as the dimming is greater on the average cloud-free days (red line) than on the average of all days (purple line). |
אין באפשרותך לדרוס את הקובץ הזה.
שימוש בקובץ
אין דפים המשתמשים בקובץ זה.
שימוש גלובלי בקובץ
אתרי הוויקי השונים הבאים משתמשים בקובץ זה:
- שימוש באתר en.wikipedia.org