File:Nomogramm zum scheinbaren Einfallen nach Palmer.pdf
מתוך Wikimedia Commons
קפיצה לניווט
קפיצה לחיפוש

גודל התצוגה המקדימה הזאת מסוג JPG של קובץ ה־PDF הזה: 430 × 599 פיקסלים. רזולוציות אחרות: 172 × 240 פיקסלים | 345 × 480 פיקסלים | 551 × 768 פיקסלים | 1,170 × 1,629 פיקסלים.
לקובץ המקורי (1,170 × 1,629 פיקסלים, גודל הקובץ: 165 ק"ב, סוג MIME: application/pdf)
מידע על הקובץ
נתונים מובְנים
כיתובים
כיתובים
נא להוסיף משפט שמסביר מה הקובץ מייצג
תקציר
[עריכה]| תיאורNomogramm zum scheinbaren Einfallen nach Palmer.pdf |
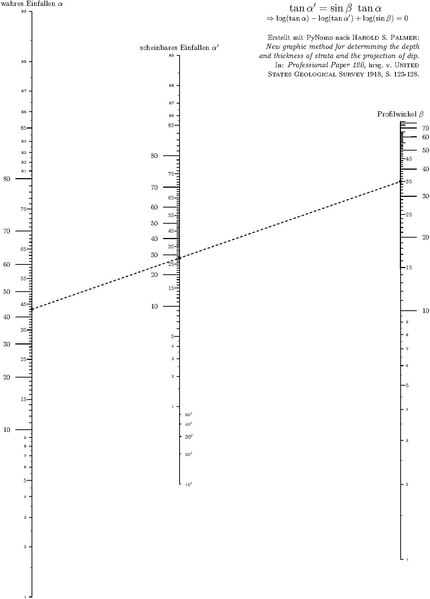
English: Created with PyNomo after Harold S. Palmer: New graphic method for determining the depth and thickness of strata and the projection of dip. In: Professional Paper 120, published by United States Geological Survey 1918, pp. 123-128.
Deutsch: Erstellt mit PyNomo nach Harold S. Palmer: New graphic method for determining the depth and thickness of strata and the projection of dip. In: Professional Paper 120, hrsg. v. United States Geological Survey 1918, S. 123-128. |
| תאריך יצירה | |
| מקור | נוצר על־ידי מעלה היצירה |
| יוצר | Gallaiis |
Python code used to create this nomogram with PyNomo.
from pynomo.nomographer import *

N_params_1={
    'u_min':1.0,
    'u_max':89.0,
    'function':lambda u:log10(tan(u*pi/180.0)),
    'title':r'wahres Einfallen $\alpha$',
    'title_x_shift':0.0,
    'tick_levels':3,
    'tick_text_levels':2,
    'tick_side':'left',
    'extra_params':[
      {
        'u_min':1.0,
        'u_max':10.0,
        'tick_levels':4,
        'tick_text_levels':3,
      },
      {
        'u_min':80.0,
        'u_max':89.0,
        'tick_levels':4,
        'tick_text_levels':3,
      },
    ],
}

N_params_2={
    'u_min':0.5,
    'u_max':89.0,
    'function':lambda u:-log10(tan(u*pi/180.0)),
    'title':r'scheinbares Einfallen $\alpha^\prime$',
    'tick_levels':3,
    'tick_text_levels':2,
    'tick_side':'left',
    'extra_params':[
      {
        'u_min':(10.0/60.0),
        'u_max':(25.0/60.0),
        'scale_type':'manual line',
        'tick_side':'right',
        'grid_length_1':0.050,
        'manual_axis_data':{
          (10.0/60.0):r"\tiny $10'$",
          (20.0/60.0):r"\tiny $20'$",
        }
      },
      {
        'u_min':(25.0/60.0),
        'u_max':(35.0/60.0),
        'scale_type':'manual line',
        'tick_side':'right',
        'grid_length_1':0.070,
        'manual_axis_data':{
          (30.0/60.0):r"\scriptsize $30'$",
        }
      },
      {
        'u_min':(35.0/60.0),
        'u_max':1.0,
        'scale_type':'manual line',
        'tick_side':'right',
        'grid_length_1':0.050,
        'manual_axis_data':{
          (40.0/60.0):r"\tiny $40'$",
          (50.0/60.0):r"\tiny $50'$",
        }
      },
      {
        'u_min':1.0,
        'u_max':5.0,
        'tick_levels':4,
        'tick_text_levels':3,
      },
      {
        'u_min':85.0,
        'u_max':89.0,
        'tick_levels':4,
        'tick_text_levels':3,
      },
    ],
}

N_params_3={
    'u_min':1,
    'u_max':85.,
    'function':lambda u:log10(sin(u*pi/180.0)),
    'title':r'Profilwinkel $\beta$',
    'tick_levels':2,
    'tick_text_levels':0,
    'extra_params':[
      {
        'u_min':1.0,
        'u_max':10.0,
        'tick_levels':4,
        'tick_text_levels':3,
      },
      {
        'u_min':11.0,
        'u_max':20.0,
        'tick_levels':3,
        'tick_text_levels':2,
      },
      {
        'u_min':21.0,
        'u_max':50.0,
        'tick_levels':3,
        'tick_text_levels':2,
      },
      {
        'u_min':51.0,
        'u_max':65.0,
        'tick_levels':3,
        'tick_text_levels':1,
      },
      {
        'u_min':65.0,
        'u_max':70.0,
        'tick_levels':2,
        'tick_text_levels':1,
      },
    ],
}

block_1_params={
    'block_type':'type_1',
    'f1_params':N_params_1,
    'f2_params':N_params_2,
    'f3_params':N_params_3,
    'proportion':(6.25/9.35),
    'isopleth_values':[[43.0,'x',35.0]],
}

main_params={
    'filename':'Nomogramm_scheinbares_Einfallen_Palmer.pdf',
    'paper_height':27.0,
    'paper_width':17.0,
    'block_params':[block_1_params],
    'title_str':r'\Large $\tan\alpha^\prime=\sin\beta\ \tan\alpha$\par\
        \normalsize $\Rightarrow \log(\tan\alpha) - \log(\tan\alpha^\prime) + \log(\sin\beta) = 0$\par\
        \raggedright\small\vskip 0.3ex\
        Erstellt mit PyNomo nach H\scriptsize AROLD\small\ S.\ P\scriptsize ALMER\small:\
        \it New graphic method for determining the depth\
        and thickness of strata and the projection of dip.\rm\small\par\
        In: \it Professional Paper 120,\rm\small\ hrsg.\ v.\
        U\scriptsize NITED\small\ S\scriptsize TATES\small\
        G\scriptsize EOLOGICAL\small\ S\scriptsize URVEY\small\ 1918, S.\ 123-128.',
    'title_x':14.0,
}

Nomographer(main_params)
רישיון
[עריכה]אני, בעל זכויות היוצרים על עבודה זו, מפרסם בזאת את העבודה תחת הרישיון הבא:
הקובץ הזה מתפרסם לפי תנאי רישיון קריאייטיב קומונז ייחוס-שיתוף זהה 3.0 לא מותאם.
- הנכם רשאים:
- לשתף – להעתיק, להפיץ ולהעביר את העבודה
- לערבב בין עבודות – להתאים את העבודה
- תחת התנאים הבאים:
- ייחוס – יש לתת ייחוס הולם, לתת קישור לרישיון, ולציין אם נעשו שינויים. אפשר לעשות את זה בכל צורה סבירה, אבל לא בשום צורה שמשתמע ממנה שמעניק הרישיון תומך בך או בשימוש שלך.
- שיתוף זהה – אם תיצרו רמיקס, תשנו, או תבנו על החומר, חובה עליכם להפיץ את התרומות שלך לפי תנאי רישיון זהה או תואם למקור.
היסטוריית הקובץ
ניתן ללחוץ על תאריך/שעה כדי לראות את הקובץ כפי שנראה באותו זמן.
| תאריך/שעה | תמונה ממוזערת | ממדים | משתמש | הערה | |
|---|---|---|---|---|---|
| נוכחית | 16:19, 9 באוגוסט 2012 |  | 1,629 × 1,170 (165 ק"ב) | Gallaiis (שיחה | תרומות) |
אין באפשרותך לדרוס את הקובץ הזה.
שימוש בקובץ
הדף הבא משתמש בקובץ הזה:
- File:Nomogramm zu scheinbaren Einfallen nach H. S. Palmer.pdf (הפניה של קובץ)
שימוש גלובלי בקובץ
אתרי הוויקי השונים הבאים משתמשים בקובץ זה:
- שימוש באתר de.wikipedia.org
מטא־נתונים
קובץ זה מכיל מידע נוסף, שכנראה הגיע ממצלמה דיגיטלית או מסורק שבהם הקובץ נוצר או עבר דיגיטציה.
אם הקובץ שונה ממצבו הראשוני, כמה מהנתונים להלן עלולים שלא לשקף באופן מלא את הקובץ הנוכחי.
| תוכנה בשימוש | PyX 0.11.1 |
|---|---|
| מוצפן | no |
| גודל דף | 562.057 x 782.967 pts |
| הגרסה של תסדיר PDF | 1.4 |