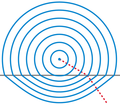
File:Snells law wavefronts.png
מתוך Wikimedia Commons
קפיצה לניווט
קפיצה לחיפוש
Snells_law_wavefronts.png (360 × 314 פיקסלים, גודל הקובץ: 62 ק"ב, סוג MIME: image/png)
מידע על הקובץ
נתונים מובְנים
כיתובים
כיתובים
נא להוסיף משפט שמסביר מה הקובץ מייצג
| תיאורSnells law wavefronts.png | Illustration of wavefronts in the context of Snell's law. |
| תאריך יצירה | (UTC) |
| מקור | self-made with MATLAB |
| יוצר | Oleg Alexandrov |

|
קובץ זה הוחלף על ידי הקובץ File:Snells law wavefronts.svg. מומלץ להשתמש בקובץ החדש. :סיבה Same image, just in SVG
|

|
| Public domainPublic domainfalsefalse |
| ברצוני, בעלי זכויות היוצרים על יצירה זו, לשחרר יצירה זו לנחלת הכלל. זה תקף בכל העולם. יש מדינות שבהן הדבר אינו אפשרי על פי חוק, אם כך: אני מעניק לכל אחד את הזכות להשתמש בעבודה זו לכל מטרה שהיא, ללא תנאים כלשהם, אלא אם כן תנאים כאלה נדרשים על פי חוק. |
% Illustration of Snell's law
function main()
   n1=1.0;
   n2=1.5;

   figure(1); clf; hold on; axis equal; axis off;
   sign = -1;% is the source up or down?
   O=[0, -1*sign];
   k=500;


% KSmrq's colors
   red    = [0.867 0.06 0.14];
   blue   = [0, 129, 205]/256;
   green  = [0, 200,  70]/256;
   yellow = [254, 194,   0]/256;
   white = 0.99*[1, 1, 1];
   black = [0, 0, 0];
   gray = 0.5*white;

   color1=red;
   color2=blue;
   color3=gray;
   lw = 4;

   plot_line=0;
   Theta=linspace(0, 2*pi, k);
   V=0*Theta; W=0*Theta;
   S0=4;
   spacing=0.45;
   p=floor(S0/spacing);
   S=linspace(0, S0, p+1)+0.1*spacing;

   % plot the interface between diellectrics
   L=3.8;
   plot([-L, L], [0, 0], 'color', color3, 'linewidth', lw);


% plot a ray
   plot_line=1;
   s=5.2;
   theta=pi/3; wfr(s, theta, n1, n2, O, sign, plot_line, color1, lw);

% plot the wafefronts
   plot_line=0;
   for i=1:p
      for j=1:k
	 s=S(i);
	 theta=Theta(j);
	 [V(j), W(j)]=wfr(s, theta, n1, n2, O, sign, plot_line, color1, lw);
      end
      plot(V, W, 'color', color2, 'linewidth', lw);
   end


   % dummy point to enlarge the bounding box
   plot(0, S0+1.5*spacing, '*', 'color', white);

   saveas(gcf, 'Snells_law_wavefronts.eps', 'psc2')


function [a, b]=wfr(s, theta, n1, n2, O, sign, plot_line, color1, lw);

   X=O+s*[sin(theta), sign*cos(theta)];

  if( sign*X(2) > 0 )
    t=-sign*O(2)/cos(theta);
    X0=O+t*[sin(theta), sign*cos(theta)];

    if (plot_line == 1)
      plot([O(1), X0(1)], [O(2), X0(2)], 'color', color1, 'linewidth', lw, 'linestyle', '--');
    end

    d = norm(O-X0);
    r = (s-d)*(n2/n1)^(sign);

    theta2=asin(n1*sin(theta)/n2);
    XE=X0+r*[sin(theta2), sign*cos(theta2)];
  else
    XE = X;
  end
  a = XE(1);
  b = XE(2);

  if (plot_line==1)
    plot([X0(1), XE(1)], [X0(2), XE(2)], 'color', color1, 'linewidth', lw, 'linestyle', '--');
  end
היסטוריית הקובץ
ניתן ללחוץ על תאריך/שעה כדי לראות את הקובץ כפי שנראה באותו זמן.
| תאריך/שעה | תמונה ממוזערת | ממדים | משתמש | הערה | |
|---|---|---|---|---|---|
| נוכחית | 05:36, 1 בינואר 2008 |  | 314 × 360 (62 ק"ב) | Oleg Alexandrov (שיחה | תרומות) | {{Information |Description=Illustration of wavefronts in the context of Snell's law. |Source=self-made with MATLAB |Date=~~~~~ |Author= Oleg Alexandrov |Permission= |other_versions= }} {{PD- |
אין באפשרותך לדרוס את הקובץ הזה.
שימוש בקובץ
הדף הבא משתמש בקובץ הזה:
