File:Stirling's Approximation.svg
둘러보기로 이동
검색으로 이동

SVG 파일의 PNG 형식의 미리보기 크기: 771 × 600 픽셀. 다른 해상도: 309 × 240 픽셀 | 617 × 480 픽셀 | 988 × 768 픽셀 | 1,280 × 996 픽셀 | 2,560 × 1,991 픽셀 | 2,700 × 2,100 픽셀
원본 파일 (SVG 파일, 실제 크기 2,700 × 2,100 픽셀, 파일 크기: 4 KB)
캡션
설명
이 파일이 나타내는 바에 대한 한 줄 설명을 추가합니다
파일 설명
[편집]| 설명 |
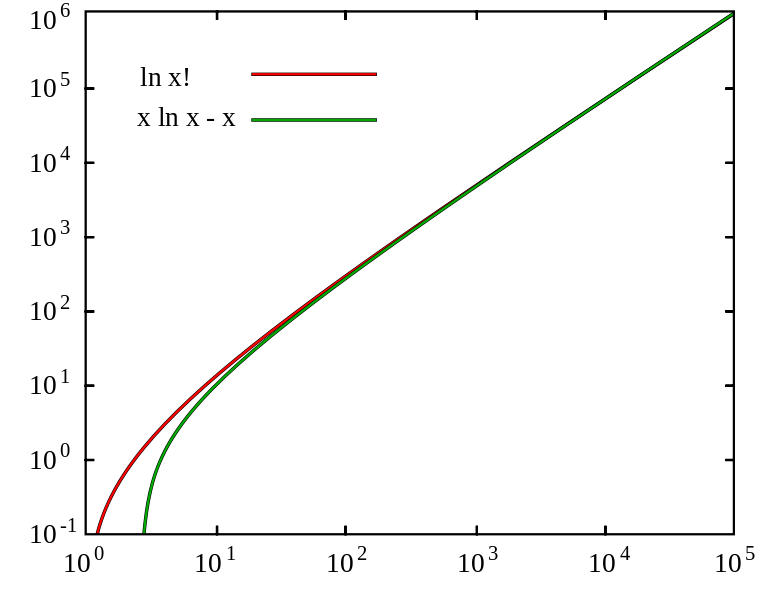
English: Stirling's approximation graph |
||
| 날짜 | |||
| 출처 | Created by me | ||
| 저자 | R. A. Nonenmacher | ||
| 저작권 (이 파일을 인용하기) |
나는 아래 작품의 저작권자로서, 이 저작물을 다음과 같은 라이선스로 배포합니다:
이 라이선스 중에서 목적에 맞는 것을 선택하여 사용할 수 있습니다. |

SVG code
[편집]
<?xml version="1.0" encoding="utf-8"?>
<!DOCTYPE svg PUBLIC "-//W3C//DTD SVG 1.1//EN" "http://www.w3.org/Graphics/SVG/1.1/DTD/svg11.dtd">
<svg version = "1.1"
     id      = "Stirling_approximation_graph"
     xmlns   = "http://www.w3.org/2000/svg"
     width   = "2700"
     height  = "2100">
<!-- ==================== Data Curves ===================== -->
<g fill="none">
   <path stroke="#000" stroke-width="12" d="M  340,1871 C 440,1470, 960,1110,2567,  50"/>
   <path stroke="#00f" stroke-width="8"  d="M  340,1871 C 440,1470, 960,1110,2567,  50"/>
   <path stroke="#000" stroke-width="12" d="M 2571,  46 C 660,1310, 544,1445, 504,1870"/>
   <path stroke="#f00" stroke-width="8"  d="M 2571,  46 C 660,1310, 544,1445, 504,1870"/>
</g>
<!-- ==================== Legend ===================== -->
<text x="490" y="300" font-size="96">ln x!</text>
<text x="480" y="440" font-size="96">x ln x - x</text>
<polyline stroke="#000" stroke-width="12" points="880,260 1320,260"/>
<polyline stroke="#00f" stroke-width="8"  points="882,260 1318,260"/>
<polyline stroke="#000" stroke-width="12" points="880,420 1320,420"/>
<polyline stroke="#f00" stroke-width="8"  points="882,420 1318,420"/>
<!-- ==================== Y-Axis Labels ===================== -->
<text x="100" y=" 100" font-size="96">10</text> <text x="210" y="  60" font-size="72">6</text>
<text x="100" y=" 340" font-size="96">10</text> <text x="210" y=" 300" font-size="72">5</text>
<text x="100" y=" 600" font-size="96">10</text> <text x="210" y=" 560" font-size="72">4</text>
<text x="100" y=" 860" font-size="96">10</text> <text x="210" y=" 820" font-size="72">3</text>
<text x="100" y="1120" font-size="96">10</text> <text x="210" y="1080" font-size="72">2</text>
<text x="100" y="1380" font-size="96">10</text> <text x="210" y="1340" font-size="72">1</text>
<text x="100" y="1640" font-size="96">10</text> <text x="210" y="1600" font-size="72">0</text>
<text x="100" y="1900" font-size="96">10</text> <text x="210" y="1860" font-size="72">-1</text>
<!-- ==================== X-Axis Labels ===================== -->
<text x="220 " y="2000" font-size="96">10</text> <text x="330 " y="1960" font-size="72">0</text>
<text x="680 " y="2000" font-size="96">10</text> <text x="790 " y="1960" font-size="72">1</text>
<text x="1140" y="2000" font-size="96">10</text> <text x="1250" y="1960" font-size="72">2</text>
<text x="1600" y="2000" font-size="96">10</text> <text x="1710" y="1960" font-size="72">3</text>
<text x="2060" y="2000" font-size="96">10</text> <text x="2170" y="1960" font-size="72">4</text>
<text x="2500" y="2000" font-size="96">10</text> <text x="2610" y="1960" font-size="72">5</text>
<!-- ================= Axes & Tick Marks ================== -->
<polygon fill="none" stroke="#000" stroke-width="8" points="
    300,  40   300, 310   330, 310   300, 310   300, 570   330, 570   300, 570
               300, 830   330, 830   300, 830   300,1090   330,1090   300,1090
               300,1350   330,1350   300,1350   300,1610   330,1610   300,1610
    300,1870   760,1870   760,1840   760,1870  1210,1870  1210,1840  1210,1870
              1670,1870  1670,1840  1670,1870  2120,1870  2120,1840  2120,1870
   2570,1870  2570,1610  2540,1610  2570,1610  2570,1350  2540,1350  2570,1350
              2570,1090  2540,1090  2570,1090  2570, 830  2540, 830  2570, 830
              2570, 570  2540, 570  2570, 570  2570, 310  2540, 310  2570, 310
   2570,  40  2120,  40  2120,  70  2120,  40  1670,  40  1670,  70  1670,  40
              1210,  40  1210,  70  1210,  40   760,  40   760,  70   760,  40"/>
</svg>
W3C-validity not checked.
파일 역사
날짜/시간 링크를 클릭하면 해당 시간의 파일을 볼 수 있습니다.
| 날짜/시간 | 섬네일 | 크기 | 사용자 | 설명 | |
|---|---|---|---|---|---|
| 현재 | 2011년 10월 19일 (수) 23:18 | | 2,700 × 2,100 (4 KB) | Bender2k14 (토론 | 기여) | fixed problem with display of the first two x-axis labels by moving the white space before the number values (instead of after) |
| 2008년 8월 19일 (화) 23:59 |  | 2,700 × 2,100 (4 KB) | Nonenmac (토론 | 기여) | == Summary == {{Information |Description={{en|1=Stirling's approximation graph}} |Source=Created by me |Author=R. A. Nonenmacher |Date=18-Aug-2008 |Permission={{self|GFDL|cc-by-sa-all}} |other_versions=[[:I |
이 파일을 덮어쓸 수 없습니다.
이 파일을 사용하는 문서
다음 문서 1개가 이 파일을 사용하고 있습니다:
이 파일을 사용하고 있는 모든 위키의 문서 목록
다음 위키에서 이 파일을 사용하고 있습니다:
- be.wikipedia.org에서 이 파일을 사용하고 있는 문서 목록
- cs.wikipedia.org에서 이 파일을 사용하고 있는 문서 목록
- el.wikipedia.org에서 이 파일을 사용하고 있는 문서 목록
- fr.wikipedia.org에서 이 파일을 사용하고 있는 문서 목록
- it.wikipedia.org에서 이 파일을 사용하고 있는 문서 목록
- kk.wikipedia.org에서 이 파일을 사용하고 있는 문서 목록
- ko.wikipedia.org에서 이 파일을 사용하고 있는 문서 목록
- lt.wikipedia.org에서 이 파일을 사용하고 있는 문서 목록
- mn.wikipedia.org에서 이 파일을 사용하고 있는 문서 목록
- ro.wikipedia.org에서 이 파일을 사용하고 있는 문서 목록
- ru.wikipedia.org에서 이 파일을 사용하고 있는 문서 목록
- sk.wikipedia.org에서 이 파일을 사용하고 있는 문서 목록
- uk.wikipedia.org에서 이 파일을 사용하고 있는 문서 목록
- zh.wikipedia.org에서 이 파일을 사용하고 있는 문서 목록