File:WeierstrassFunction.svg
קפיצה לניווט
קפיצה לחיפוש

גודל התצוגה המקדימה הזאת מסוג PNG של קובץ ה־SVG הזה: 795 × 505 פיקסלים. רזולוציות אחרות: 320 × 203 פיקסלים | 640 × 407 פיקסלים | 1,024 × 650 פיקסלים | 1,280 × 813 פיקסלים | 2,560 × 1,626 פיקסלים.
לקובץ המקורי (קובץ SVG, הגודל המקורי: 795 × 505 פיקסלים, גודל הקובץ: 120 ק"ב)
כיתובים
כיתובים
נא להוסיף משפט שמסביר מה הקובץ מייצג
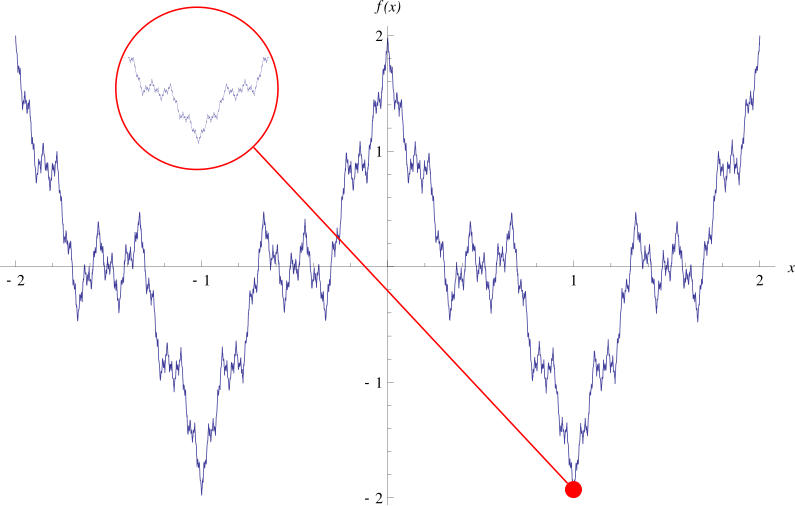
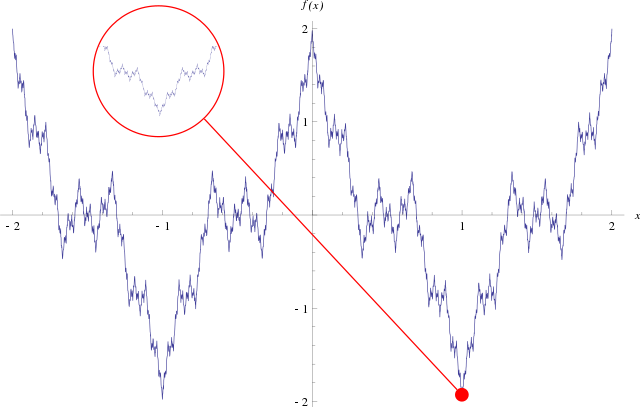
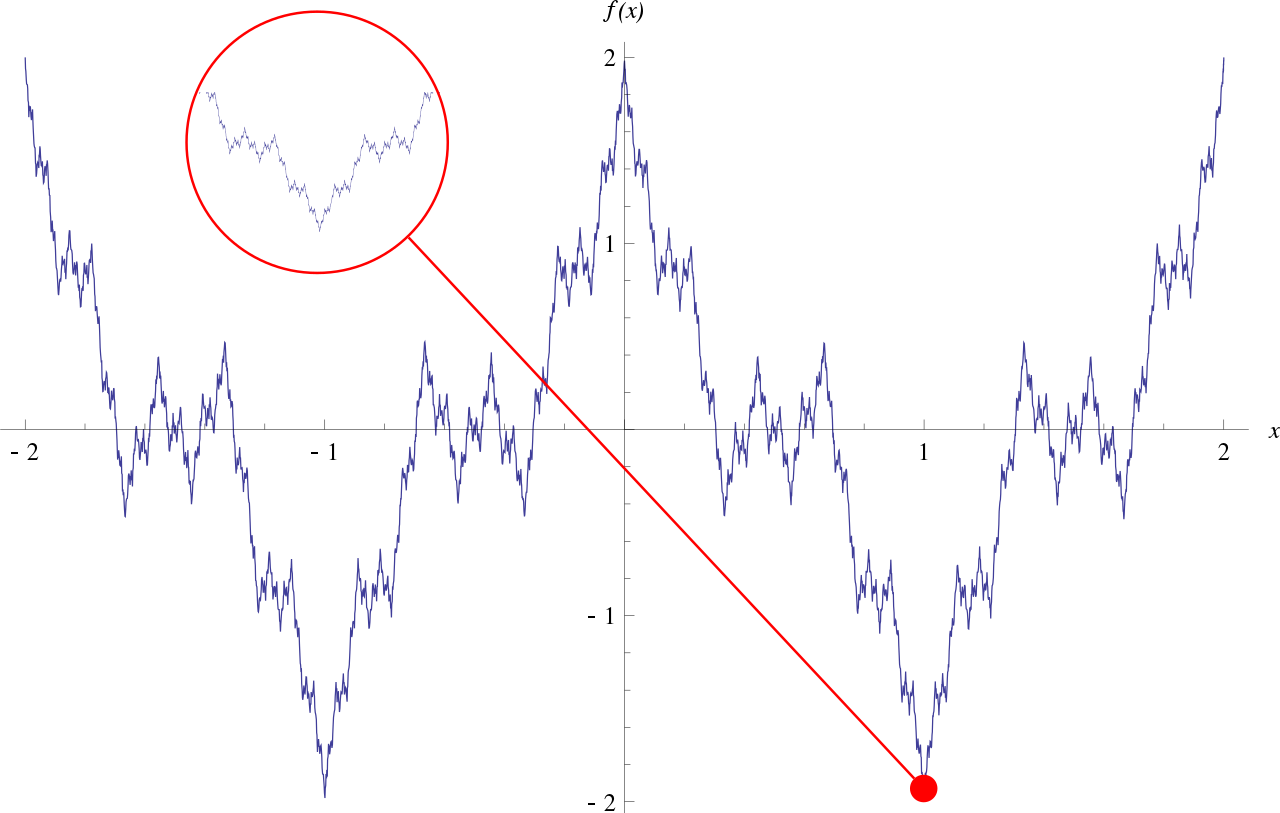
Plot of function of Weierstrass on the interval [−2, 2]. Like some other fractals, the function exhibits self-similarity: every zoom (red circle) is similar to the global plot. The function is continuous everywhere but differentiable nowhere.
תקציר
[עריכה]
| תיאור |
English: Plot of the Weierstrass function. A section of the plot is zoomed in on to illustrate the fractal nature of the function. The plot was generated using Mathematica and exported to SVG. I first made a plot of the region and then a plot of a much smaller section around the red point on the image. With the use of Inkscape, I was able to put the two in the same SVG file. This file is an Inkscape SVG, not a plain SVG. |
| תאריך יצירה | |
| מקור | נוצר על־ידי מעלה היצירה |
| יוצר | Eeyore22 |
| גרסאות אחרות | File:Weierstrass_function.gif |
W3C-validity not checked.
רישיון
[עריכה]
| ברצוני, בעלי זכויות היוצרים על יצירה זו, לשחרר יצירה זו לנחלת הכלל. זה תקף בכל העולם. יש מדינות שבהן הדבר אינו אפשרי על פי חוק, אם כך: אני מעניק לכל אחד את הזכות להשתמש בעבודה זו לכל מטרה שהיא, ללא תנאים כלשהם, אלא אם כן תנאים כאלה נדרשים על פי חוק. |
היסטוריית הקובץ
ניתן ללחוץ על תאריך/שעה כדי לראות את הקובץ כפי שנראה באותו זמן.
| תאריך/שעה | תמונה ממוזערת | ממדים | משתמש | הערה | |
|---|---|---|---|---|---|
| נוכחית | 00:44, 27 באוקטובר 2008 | | 505 × 795 (120 ק"ב) | Eeyore22~commonswiki (שיחה | תרומות) | {{Information |Description={{en|1=Plot of the Weierstrass function. A section of the plot is zoomed in on to illustrate the fractal nature of the function.}} |Source=Own work by uploader |Author=Eeyore22 |Date=October 26, 2008 |Permissio |
אין באפשרותך לדרוס את הקובץ הזה.
שימוש בקובץ
הדפים הבאים משתמשים בקובץ הזה:
שימוש גלובלי בקובץ
אתרי הוויקי השונים הבאים משתמשים בקובץ זה:
- שימוש באתר ar.wikipedia.org
- שימוש באתר bg.wikipedia.org
- שימוש באתר ca.wikipedia.org
- שימוש באתר cs.wikipedia.org
- שימוש באתר cv.wikipedia.org
- שימוש באתר de.wikipedia.org
- שימוש באתר de.wikiversity.org
- Kurs:Mathematik für Anwender (Osnabrück 2011-2012)/Teil I/Vorlesung 15
- Kurs:Mathematik für Anwender (Osnabrück 2011-2012)/Teil I/Vorlesung 15/kontrolle
- Kurs:Analysis (Osnabrück 2013-2015)/Teil I/Vorlesung 12
- Kurs:Analysis (Osnabrück 2014-2016)/Teil I/Vorlesung 12
- Kurs:Analysis (Osnabrück 2014-2016)/Teil I/Vorlesung 12/kontrolle
- Kurs:Grundkurs Mathematik (Osnabrück 2016-2017)/Teil II/Vorlesung 51
- Kurs:Grundkurs Mathematik (Osnabrück 2016-2017)/Teil II/Vorlesung 51/kontrolle
- Kurs:Grundkurs Mathematik (Osnabrück 2018-2019)/Teil II/Vorlesung 51
- Kurs:Grundkurs Mathematik (Osnabrück 2018-2019)/Teil II/Vorlesung 51/kontrolle
- Kurs:Mathematik für Anwender (Osnabrück 2019-2020)/Teil I/Vorlesung 10
- Kurs:Mathematik für Anwender (Osnabrück 2019-2020)/Teil I/Vorlesung 10/kontrolle
- Kurs:Mathematik für Anwender (Osnabrück 2019-2020)/Teil I/Repetitorium/Vorlesung 10
- Kurs:Mathematik für Anwender (Osnabrück 2020-2021)/Teil I/Vorlesung 10
- Kurs:Mathematik für Anwender (Osnabrück 2020-2021)/Teil I/Vorlesung 10/kontrolle
- Kurs:Analysis (Osnabrück 2021-2023)/Teil I/Vorlesung 12
- Stetige Funktion/K/Motivation/Einführung/Textabschnitt
- Kurs:Analysis (Osnabrück 2021-2023)/Teil I/Vorlesung 12/kontrolle
- Kurs:Grundkurs Mathematik (Osnabrück 2022-2023)/Teil II/Vorlesung 51
- Kurs:Grundkurs Mathematik (Osnabrück 2022-2023)/Teil II/Vorlesung 51/kontrolle
- Kurs:Analysis (Osnabrück 2013-2015)/Teil I/Vorlesung 12/kontrolle
- Reelle Zahlen/Stetige Funktionen/Motivation/Einführung/Textabschnitt
- Kurs:Maßtheorie auf topologischen Räumen/Differenzierbarkeit in Analysis und Funktiontheorie
- Reelle Funktionen/Stetig/Einführung/Textabschnitt
- Kurs:Mathematik für Anwender (Osnabrück 2023-2024)/Teil I/Vorlesung 10
- Kurs:Mathematik für Anwender (Osnabrück 2023-2024)/Teil I/Vorlesung 10/kontrolle
- שימוש באתר el.wikipedia.org
- שימוש באתר en.wikipedia.org
- שימוש באתר en.wikibooks.org
- שימוש באתר en.wikiversity.org
- Real numbers/Continuous functions/Motivation/Introduction/Section
- Mathematics for Applied Sciences (Osnabrück 2023-2024)/Part I/Lecture 10
- Mathematics for Applied Sciences (Osnabrück 2023-2024)/Part I/Lecture 10/latex
- Mathematics for Applied Sciences (Osnabrück 2023-2024)/Part I/Lecture 10/refcontrol
- שימוש באתר en.wiktionary.org
- שימוש באתר es.wikipedia.org
- שימוש באתר et.wikipedia.org
- שימוש באתר eu.wikipedia.org
- שימוש באתר fa.wikipedia.org
- שימוש באתר fr.wikipedia.org
צפייה בשימושים גלובליים נוספים של קובץ זה.