Category:Economy of the European Union
Jump to navigation
Jump to search
Member states of the European Union: Austria [AT] · Belgium [BE] · Bulgaria [BG] · Croatia [HR] · Cyprus [CY] · Czech Republic [CZ] · Denmark [DK] · Estonia [EE] · Finland [FI] · France [FR] · Germany [DE] · Greece [EL] · Hungary [HU] · Republic of Ireland [IE] · Italy [IT] · Latvia [LV] · Lithuania [LT] · Luxembourg [LU] · Malta [MT] · Netherlands [NL] · Poland [PL] · Portugal [PT] · Romania [RO] · Slovakia [SK] · Slovenia [SI] · Spain [ES] · Sweden [SE]
Outermost regions: Azores [PT20] · Canary Islands [ESCN] · French Guiana [GF] · Guadeloupe [GP] · Madeira [PT30] · Martinique [MQ] · Mayotte [YT] · Réunion [RE] · Saint-Martin [MF] (FR)
Included territories with special status: Åland [AX] · Ceuta [ESCE] · Melilla [ESML] · Mount Athos [EL69]
Overseas countries and territories: Aruba [AW] · Caribbean Netherlands [BQ] · Curaçao [CW] · French Polynesia [PF] · French Southern and Antarctic Lands [TF] · Greenland [GL] · New Caledonia [NC] · Saint Barthélemy [BL] · Sint Maarten [SX] (NL) · Saint Pierre and Miquelon [PM] · Wallis and Futuna [WF]
Excluded territories by special provision: Faroe Islands [FO] · Northern Cyprus [CYXNO]
Candidate countries: Albania [AL] · Bosnia and Herzegovina [BA] · Moldova [MD] · Montenegro [ME] · North Macedonia [MK] · Serbia [RS] · Turkey [TR] · Ukraine [UA]
Former member countries or territories: Algeria [DZ] · Anguilla [AI] · Bermuda [BM] · British Virgin Islands [VG] · Falkland Islands [FK] · Gibraltar [GI] · Bailiwick of Guernsey [GG] · Isle of Man [IM] · Jersey [JE] · Montserrat [MS] · Saint Helena, Ascension and Tristan da Cunha [SH] · Turks and Caicos Islands [TC] · United Kingdom [UK]
economy of the region .jpg) | |||||
| Upload media | |||||
| Instance of |
| ||||
|---|---|---|---|---|---|
| Subclass of | |||||
| Location | EU | ||||
| Currency | |||||
| Different from | |||||
| |||||
European Union | ||
|---|---|---|
| ||
|
Subcategories
This category has the following 39 subcategories, out of 39 total.
.
- .eu (13 F)
B
C
D
E
- EU Gateway (3 F)
- European Fisheries Fund (1 F)
F
G
H
I
L
M
N
P
- PIIGS (1 P, 58 F)
R
S
T
U
Media in category "Economy of the European Union"
The following 118 files are in this category, out of 118 total.
-
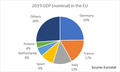 2019 GDP (nominal) in UE.png 482 × 289; 11 KB
-
 ACEA agreement progress.png 393 × 275; 9 KB
-
 Agrarium logo.png 384 × 90; 12 KB
-
 Balance commerciale de biens et services (Pays de L'Eurozone).gif 1,241 × 634; 42 KB
-
 Car Sales Europe April 2020.png 708 × 603; 36 KB
-

-

-
-

-
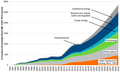
 Cumulative RES knowledge stock induced by public R&D expenditures of the EC.png 3,463 × 2,121; 1.07 MB
-
 Cumulative RES knowledge stock induced by public R&D expenditures of the EU MS and the EC.png 3,460 × 2,128; 1,024 KB
-
 Deficites y endeudamiento de países de la eurozona in 2009.png 1,068 × 750; 38 KB
-
 Dette publique PIB 2010.JPG 1,000 × 562; 53 KB
-
 Dette publique € par habitant 2010.JPG 955 × 429; 43 KB
-
 Deutepublicspib.jpeg 629 × 356; 73 KB
-
 Deutepúblic.jpeg 629 × 356; 70 KB
-
 Economic connections between US, EU, China, Russia and India.png 492 × 522; 41 KB
-
 ElectricityUCTE-hu.svg 1,280 × 1,360; 370 KB
-
 ElectricityUCTE.svg 1,450 × 1,400; 353 KB
-
 EU Big 4 GNI Comparison.PNG 593 × 322; 12 KB
-
 EU Countries as per Annual GDP (2022) (HY).jpg 3,400 × 4,400; 2.19 MB
-
 EU EFTA DCFTA EUCU.svg 680 × 520; 597 KB
-
 EU GDP.png 635 × 573; 58 KB
-
-
 Eu handelsbilanz.svg 800 × 600; 25 KB
-
 EU HDI 2011.svg 645 × 690; 532 KB
-
 EU member states trade balance with Russia 2012.svg 1,212 × 1,242; 545 KB
-
 EU quarterly current account.jpg 1,095 × 805; 101 KB
-
 Eu-gateway-business-avenues-1990-2020-timeline-72dpi-RGB.jpg 1,191 × 843; 406 KB
-
 Eu-gateway-business-avenues-2016-2020-map-72dpi-RGB rev01.jpg 3,508 × 2,656; 1.33 MB
-
 EU-GDP-Population.png 1,000 × 728; 39 KB
-
 EU-GDP-Population.svg 800 × 600; 31 KB
-
 EU-GDP-PPP-pc.png 955 × 653; 20 KB
-
 EU-GDP-PPP.png 955 × 653; 19 KB
-
 EUFarm-eng.svg 703 × 523; 145 KB
-
 Euro to Swiss Franc exchange rate.webp 1,500 × 397; 23 KB
-
 Europe economic space members.PNG 1,001 × 554; 82 KB
-
 Europe minimum wage 2021.png 2,488 × 2,448; 1.05 MB
-
 Europe tax rates.svg 444 × 487; 723 KB
-
 European union gdp 2002 low diagram de.png 450 × 450; 8 KB
-
 European union gdp diagram de.png 500 × 620; 9 KB
-
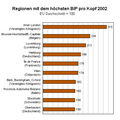 European union gdp high diagram 2002 de.png 450 × 450; 14 KB
-
 European Union Total Primary Energy Consumption in 2015.svg 898 × 431; 295 KB
-
 European VAT Tax Rates.webp 1,240 × 1,098; 124 KB
-
 European-union-gdp-diagram-de.svg 1,450 × 1,400; 6 KB
-
 Europeanuniongdphighdiagramde.svg 512 × 446; 3 KB
-
 Europeanuniongdplowdiagramde.svg 512 × 446; 2 KB
-
 EuropeanunionGDPpercapita.png 1,104 × 920; 66 KB
-
 EuropeanunionGDPpercapita2.png 1,104 × 920; 57 KB
-
 Europäische Zollunion und Partnerstaaten.svg 680 × 520; 419 KB
-
 Europäische Zollunion.svg 680 × 520; 454 KB
-
 Exchange rate regime of EU countries according to Reinhart and Rogoff.png 1,135 × 419; 40 KB
-
 FarmlandinEU2.gif 658 × 460; 17 KB
-
 Fisheryexpenditure2004.png 594 × 375; 13 KB
-
 Gefühlte Inflation.svg 638 × 412; 96 KB
-
 Gengov vs self.png 1,005 × 647; 22 KB
-

-

-
 Government surplus or deficit since 2001 (piiggs and US).svg 616 × 891; 179 KB
-
 Graph 02 spending per country.jpg 800 × 395; 69 KB
-
 Graph of average growth rate of EU countries and Euro zone.png 726 × 332; 24 KB
-
 Imports, exports, balance of EU trade in goods.JPG 1,096 × 748; 89 KB
-
 Income Share of Top 10% in Croatia and the EU, 2010 - 2017.svg 512 × 256; 12 KB
-
 Information sign about european union project (Cerbona Élelmiszergyártó Zrt.).jpg 4,608 × 3,456; 4.5 MB
-
 Japan eksport to EU 2017.jpg 592 × 490; 82 KB
-
 Japan FDI in EU 2006-2016.png 598 × 418; 18 KB
-
 Japan import from EU 2017.jpg 590 × 506; 93 KB
-
 Looking a gift horse in the mouth.png 1,108 × 1,570; 177 KB
-
 Member states' share of financing the UK rebate.png 600 × 371; 14 KB
-
 MoldovanGDPBySector.svg 1,250 × 1,500; 154 KB
-
 Monthly unemployment rates EU.png 970 × 604; 28 KB
-
 NACE chooser.png 826 × 662; 14 KB
-
 Passagers aériens Europe 2019-2020.png 454 × 291; 28 KB
-
 Passagers aériens Europe janvier - juin 2020.png 362 × 235; 21 KB
-
 Passenger Car Sales Europe December 2020.png 3,387 × 2,892; 440 KB
-
 Passenger Car Sales Europe June 2020.png 688 × 603; 34 KB
-
 Passenger Car Sales Europe May 2020.png 708 × 603; 41 KB
-
 Passenger Car Sales Europe September 2020.png 736 × 603; 40 KB
-
 PIB et Budget UE 2000 2019.png 654 × 476; 45 KB
-
 PIGSmap.png 1,218 × 1,245; 52 KB
-
 PIGSmap.svg 454 × 450; 350 KB
-
 Piiggs balance sheet 2009.png 2,949 × 2,160; 96 KB
-
 Piiggs superávits 2002-2009.PNG 3,117 × 2,369; 350 KB
-
 Piiggs surplus 2002-2009.png 473 × 615; 89 KB
-
 PIIGGSmap.svg 454 × 450; 478 KB
-
 Piigs debt 2002-2009.png 979 × 633; 134 KB
-
 Piigs growth 2005-2009.png 3,117 × 2,188; 251 KB
-
 PKB w USD PPP najwiekszych gospodarek jako odsetek PKB swiata.svg 1,600 × 815; 210 KB
-
 Pommes de terre gm UE 2010.svg 574 × 418; 133 KB
-
 Preissteigerung 1970-1980.png 596 × 541; 22 KB
-
 Prix à la consommation en zone euro.PNG 1,309 × 457; 106 KB
-
 Recettes budget UE répartition 1988.png 216 × 215; 8 KB
-
 Recettes budget UE répartition 2000.png 216 × 216; 7 KB
-
 Recettes budget UE répartition 2007.png 216 × 216; 7 KB
-
 Recettes budget UE répartition 2014.png 216 × 216; 7 KB
-

-

-

-

-
 Répartition Budget UE 2000-2006 en %.png 288 × 288; 14 KB
-
 Répartition budget UE 2007-2013 en %.png 289 × 288; 15 KB
-
 Répartition budget UE 2014-2020 en %.png 288 × 288; 14 KB
-
 Répartition Budget UE CFP 2000-2006 en %.png 288 × 288; 14 KB
-
 SEPA.PNG 450 × 422; 5 KB
-

-
 Share of Top 10% on income in Croatia and the EU, 2010 - 2017.svg 512 × 284; 12 KB
-
 Spanishdebt.jpg 1,262 × 829; 125 KB
-
 Supportforjoiningeuro.png 1,194 × 960; 186 KB
-
 Taux TVA UE 07-2011.jpg 660 × 947; 128 KB
-
 The interrelatedness of the EU market.png 2,000 × 2,000; 1.25 MB
-
 Top Marginal Tax Rates In Europe.webp 1,240 × 1,068; 153 KB
-
 Top10% Income Share PL CZ DE EU LT SK 2005-2017 EUSILC.svg 512 × 284; 26 KB
-
 Transfers-ue-pl.svg 965 × 439; 80 KB
-
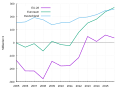
 Unemployment rate United states - Europe 1993-2013.png 578 × 501; 24 KB
-
 Variation PIB - GDP T4 2020.png 2,640 × 1,760; 182 KB
-
 Variation PIB - GDP UE T3 2020.png 575 × 384; 25 KB
-
 Variation PIB - GDP Union européenne.png 575 × 344; 27 KB
-
 Who benefits from the ESF?.jpg 799 × 245; 52 KB
_in_UE.png)

.gif)

.png)
.png)
.png)
.png)


_(HY).jpg)


_2003.png)


.svg)


.jpg)


.png)
.png)
.png)
.png)


