Category:Economy of California
Zur Navigation springen
Zur Suche springen
Español: Economía de California
Bundesstaaten der Vereinigten Staaten: Alabama · Alaska · Arizona · Arkansas · Colorado · Connecticut · Delaware · Florida · Georgia · Hawaii · Idaho · Illinois · Indiana · Iowa · Kalifornien · Kansas · Kentucky · Louisiana · Maine · Maryland · Massachusetts · Michigan · Minnesota · Mississippi · Missouri · Montana · Nebraska · Nevada · New Hampshire · New Jersey · New Mexico · New York · North Carolina · North Dakota · Ohio · Oklahoma · Oregon · Pennsylvania · Rhode Island · South Carolina · South Dakota · Tennessee · Texas · Utah · Vermont · Virginia · Washington · West Virginia · Wisconsin · Wyoming – Washington, D.C.
Amerikanisch-Samoa · Amerikanische Jungferninseln · Guam · Nördliche Marianen · Puerto Rico
Amerikanisch-Samoa · Amerikanische Jungferninseln · Guam · Nördliche Marianen · Puerto Rico
Überblick über die Wirtschaft im US-Bundesstaat Kalifornien | |||||
| Medium hochladen | |||||
| Ist ein(e) |
| ||||
|---|---|---|---|---|---|
| Unterklasse von | |||||
| Ort | Kalifornien, Pacific States Region | ||||
| |||||
Unterkategorien
Es werden 38 von insgesamt 38 Unterkategorien in dieser Kategorie angezeigt:
In Klammern die Anzahl der enthaltenen Kategorien (K), Seiten (S), Dateien (D)
Medien in der Kategorie „Economy of California“
Folgende 37 Dateien sind in dieser Kategorie, von 37 insgesamt.
-
 California economic regions map (labeled and colored).svg 621 × 733; 635 KB
-
 1-1616787879-1350x545.jpg 1.350 × 545; 704 KB
-
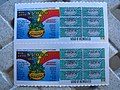 1st California Lottery Tickets.jpg 2.048 × 1.536; 1,51 MB
-
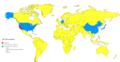
 2016 GDP comparison by country or US state.png 6.460 × 3.455; 1,46 MB
-
 2017 GDP comparison by country or US state.png 6.288 × 3.248; 2,02 MB
-
 2020 California economy compared to rest of U.S. and other countries.png 6.288 × 3.248; 1,67 MB
-
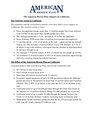 American Rescue Plan Fact Sheet - Impacts on California.pdf 1.275 × 1.650; 148 KB
-
 CALIFORNIA - NARA - 542850.jpg 2.012 × 3.000; 5,48 MB
-
 CALIFORNIA - NARA - 542851.jpg 2.019 × 3.000; 4,91 MB
-
 California counties by GDP 2021.png 4.327 × 4.326; 1,22 MB
-
 California economic region county map.svg 621 × 733; 280 KB
-
 California fish and game (19891549504).jpg 2.896 × 1.814; 803 KB
-
 California fish and game (19893284363).jpg 2.912 × 1.810; 799 KB
-
 California GDP by Sector 2015.svg 739 × 490; 74 KB
-
 California GDP by sector 2017.png 1.500 × 1.000; 115 KB
-
 California vs US Unemployment 1976-2021.png 1.168 × 450; 88 KB
-
 CamembertEnergiesCalifornie.png 900 × 558; 1,44 MB
-
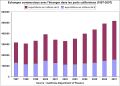 Commerce ext CA 1997-2007.svg 755 × 536; 97 KB
-
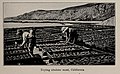 Drying abalone meat, photo from The Encyclopedia of Food by Artemas Ward.jpg 1.888 × 1.172; 1,48 MB
-
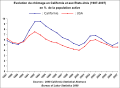 Evol chomage Ca USA 1987-2007.svg 607 × 447; 118 KB
-
 Example 2009 CA furlough closing.png 292 × 393; 210 KB
-
 Grand central market.jpg 500 × 375; 183 KB
-

-

-
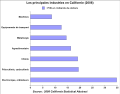 Industrie CA 2006.svg 683 × 533; 104 KB
-
 Long beach3 (cropped).jpg 988 × 588; 890 KB
-
 Long beach3.jpg 1.200 × 685; 1,11 MB
-
 Old bank district.jpg 500 × 333; 122 KB
-
 PIB Ca 1987-2007.svg 544 × 453; 103 KB
-
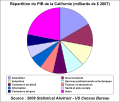 Repartition PIB CA 2007.svg 469 × 398; 98 KB
-
 SanDiegoCentral.gif 500 × 500; 56 KB
-
 Struc PA CA 1950.svg 542 × 422; 102 KB
-
 Struc PA CA 2007.svg 604 × 443; 102 KB
-
 Survey for medical marihuana in California.png 2.412 × 2.236; 260 KB
-
 The California Desert Conservation Area Plan, 1980 (1980) (20503547362).jpg 2.812 × 3.768; 615 KB
-
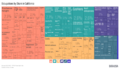 Tree Map of Occupations by Share in California (2014).png 2.320 × 1.362; 788 KB
-
 USA 2008 unemployment by county BW.svg 555 × 352; 1,37 MB
.svg)


.jpg)
.jpg)


_NL.svg)
.svg)

.jpg)


_(20503547362).jpg)
.png)
