Category:Statistical software
Aller à la navigation
Aller à la recherche
type de logiciels | |||||
| Téléverser des médias | |||||
| Nature de l’élément |
| ||||
|---|---|---|---|---|---|
| Sous-classe de | |||||
| |||||
Sous-catégories
Cette catégorie comprend 12 sous-catégories, dont les 12 ci-dessous.
Média dans la catégorie « Statistical software »
Cette catégorie comprend 62 fichiers, dont les 62 ci-dessous.
-
 ADaMSoft.jpg 1 278 × 800 ; 84 kio
-
 Airline-screenshot.png 800 × 600 ; 100 kio
-
 Amira Screenshot with Honeybee Brain visualization.png 1 920 × 1 080 ; 903 kio
-
 Animazione debito pubblico disoccupazione ricerca(small).gif 400 × 317 ; 285 kio
-
 Awstats logo5.png 238 × 54 ; 4 kio
-
 CHAOTimeSeries.jpg 640 × 480 ; 42 kio
-
 Clickpath Analysis.png 1 228 × 789 ; 110 kio
-
 CogStat logo.jpg 295 × 237 ; 17 kio
-
 CrimeStat GUI.png 960 × 720 ; 168 kio
-
 Dataploresmall.jpg 640 × 337 ; 50 kio
-
 Demetra+Application.png 1 280 × 994 ; 128 kio
-
 EasyPlot z grid3.PNG 853 × 853 ; 40 kio
-
 Emka iox fully customizable display.png 1 027 × 743 ; 29 kio
-
 Epiinfoanalisis.jpg 1 280 × 800 ; 290 kio
-
 Example of a scatter plot in stratified by sex.jpg 587 × 585 ; 88 kio
-

-
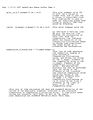
 Example of PROC Univariate Output from SAS.jpg 1 513 × 3 817 ; 724 kio
-
 Example of side-by-side box plots in R.jpg 587 × 586 ; 103 kio
-
 G*Power screenshot.PNG 610 × 732 ; 47 kio
-
 Ggobi-cube6-1.jpg 378 × 404 ; 16 kio
-
 Ggobi-cube6-index.jpg 408 × 233 ; 17 kio
-
 Ggobi-cube6-optimized.jpg 378 × 404 ; 15 kio
-
 Ggobi-flea2.png 447 × 377 ; 36 kio
-
 Ggplot2scatter.png 750 × 550 ; 26 kio
-
 Hcov.jpg 1 061 × 572 ; 98 kio
-
 HydrocodeP10.jpg 668 × 818 ; 88 kio
-
 HydrocodeStat1.jpg 1 275 × 1 650 ; 284 kio
-
 HydrocodeStat2.jpg 1 278 × 1 652 ; 248 kio
-
 HydrocodeStat3.jpg 1 279 × 1 653 ; 215 kio
-
 HydrocodeStat4.jpg 1 278 × 1 652 ; 218 kio
-
 HydrocodeStat5.jpg 1 276 × 1 651 ; 123 kio
-
 Hyperbas1.jpg 595 × 434 ; 61 kio
-
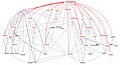
 Hyperbase arbre.png 646 × 574 ; 17 kio
-
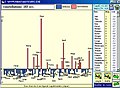
 Hyperbase graphecooc.jpg 528 × 284 ; 41 kio
-
 KXEN logo.png 455 × 170 ; 11 kio
-
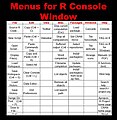 Menus for R console window.jpg 720 × 738 ; 158 kio
-
 Menus for R graphics window.jpg 720 × 614 ; 83 kio
-
 Menus for R script window.jpg 720 × 718 ; 133 kio
-
 Ncover.jpg 1 528 × 1 148 ; 403 kio
-
 NQuery Powering Sample Size.jpg 824 × 198 ; 67 kio
-
 NQuery Sample Size Software - Power Analysis Software.jpg 1 366 × 728 ; 260 kio
-
 NQuery Sample Size Software from Statsols Logo.jpg 973 × 479 ; 80 kio
-
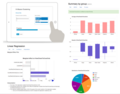 NumberAnalytics Wikipedia comparison.png 982 × 769 ; 181 kio
-
 OpenMxguineapig.png 198 × 128 ; 14 kio
-
 PSPP-home-screen.png 1 920 × 965 ; 49 kio
-
 Quantitative parasitology 2.JPG 600 × 433 ; 58 kio
-
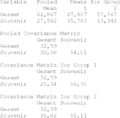
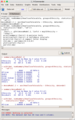 R commander ANOVA screenshot.png 591 × 949 ; 116 kio
-
 Regression graphs from auto dataset in Stata 17.png 1 166 × 848 ; 69 kio
-
 RelPad 2.jpg 990 × 750 ; 205 kio
-
 Schaetzungen Freizeitpark-Beispiel.png 673 × 661 ; 17 kio
-
 Scidavis 0.1.0 screenshot.png 861 × 677 ; 69 kio
-
 Sdmx logo.png 193 × 77 ; 5 kio
-
 Seasonal Adjustment with X-13ARIMA-SEATS program in NumXL.png 1 280 × 800 ; 140 kio
-
 Stata 16 on Microsoft Windows.png 1 436 × 1 009 ; 63 kio
-
 Stata 17 on Microsoft Windows.png 1 920 × 1 020 ; 80 kio
-
 Statistica logo statsoft.jpg 384 × 46 ; 25 kio
-
 Temissivity.jpg 1 412 × 577 ; 117 kio
-
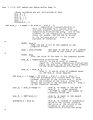
 Testing Numerical Instabilities In Numerical Hydrocodes.jpg 1 284 × 1 657 ; 192 kio
-
 TitlePage.jpg 1 150 × 1 501 ; 167 kio
-
 UGENE 1 2 0 screenshot.png 1 152 × 830 ; 81 kio
-
 Wavepacket-animation-tiny.gif 150 × 175 ; 463 kio
-
 WikiDemetra+logo.png 360 × 78 ; 2 kio


.gif)


