File:Fourier synthesis square wave animated.gif
Fourier_synthesis_square_wave_animated.gif (400 × 400 pixels, file size: 102 KB, MIME type: image/gif, looped, 15 frames, 3.8 s)
Captions
Captions
Summary[edit]
| DescriptionFourier synthesis square wave animated.gif |
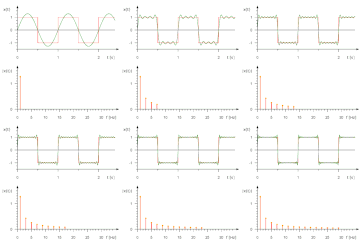
English: An animation showing the Fourier synthesis of a square wave with the first 15 approximations of the Fourier series. Below a frequency domain analysis for the current approximation is displayed.
Deutsch: Die Animation zeigt die Fouriersynthese eines Rechtecksignals mit den ersten 15 Approximationen der Fourierreihe. Unterhalb der ersten Abbildung ist das Amplitudenspektrum der jeweiligen Approximation abgebildet. |
| Date | |
| Source | Own work |
| Author | René Schwarz |
Created with Gnuplot 4.4.0, Inkscape and The GIMP.
Source Code for the 15th step in Gnuplot: <source enclose="div" line lang="gnuplot"> reset set terminal windows set terminal svg size 400,400 set output "SquareWave15.svg" set multiplot layout 2,1 unset key set border 3 set zeroaxis lt -1 set lmargin 7 set rmargin 2 set tmargin 2 set bmargin 2 set samples 10000
set yr [-1.5:1.5] set xr [0:2.4] set xtics out 1 set mxtics 2 set ytics out 1 set mytics 4 set pointsize .5 set label "x(t)" at -5,3.9 font "Verdana,12" set label "|x(t)|" at -5.5,1.5 font "Verdana,12" set label "t [s]" at 32,2.025 font "Verdana,12" set label "f [Hz]" at 31.7,-0.32 font "Verdana,12"
w = 2*pi
plot '-' with lines 1, 4/pi*sin(w*x) \
+ 4/(3*pi)*sin(3*w*x) \
+ 4/(5*pi)*sin(5*w*x) \
+ 4/(7*pi)*sin(7*w*x) \
+ 4/(9*pi)*sin(9*w*x) \
+ 4/(11*pi)*sin(11*w*x) \
+ 4/(13*pi)*sin(13*w*x) \
+ 4/(15*pi)*sin(15*w*x) \
+ 4/(17*pi)*sin(17*w*x) \
+ 4/(19*pi)*sin(19*w*x) \
+ 4/(21*pi)*sin(21*w*x) \
+ 4/(23*pi)*sin(23*w*x) \
+ 4/(25*pi)*sin(25*w*x) \
+ 4/(27*pi)*sin(27*w*x) \
+ 4/(29*pi)*sin(29*w*x) \
with lines 2 0 1 0.5 1 0.5 -1 1 -1 1 1 1.5 1 1.5 -1 2 -1 2 1 2.5 1 e
set xr [0:34.9] set yr [0:1.5] set xtics out 5 set mxtics 5 set mytics 10
plot '-' with impulses lw 2, '-' with points 7 1 1.2732 3 0.4244 5 0.2546 7 0.1818 9 0.1414 11 0.1157 13 0.0979 15 0.0848 17 0.0748 19 0.0670 21 0.0606 23 0.0553 25 0.0509 27 0.0471 29 0.0439 e 1 1.2732 3 0.4244 5 0.2546 7 0.1818 9 0.1414 11 0.1157 13 0.0979 15 0.0848 17 0.0748 19 0.0670 21 0.0606 23 0.0553 25 0.0509 27 0.0471 29 0.0439 e
unset multiplot set terminal windows reset clear </syntaxhighlight>
Licensing[edit]

|
Permission is granted to copy, distribute and/or modify this document under the terms of the GNU Free Documentation License, Version 1.2 or any later version published by the Free Software Foundation; with no Invariant Sections, no Front-Cover Texts, and no Back-Cover Texts. A copy of the license is included in the section entitled GNU Free Documentation License.http://www.gnu.org/copyleft/fdl.htmlGFDLGNU Free Documentation Licensetruetrue |
- You are free:
- to share – to copy, distribute and transmit the work
- to remix – to adapt the work
- Under the following conditions:
- attribution – You must give appropriate credit, provide a link to the license, and indicate if changes were made. You may do so in any reasonable manner, but not in any way that suggests the licensor endorses you or your use.
- share alike – If you remix, transform, or build upon the material, you must distribute your contributions under the same or compatible license as the original.
File history
Click on a date/time to view the file as it appeared at that time.
| Date/Time | Thumbnail | Dimensions | User | Comment | |
|---|---|---|---|---|---|
| current | 16:59, 16 August 2010 |  | 400 × 400 (102 KB) | René Schwarz (talk | contribs) | {{Information |Description={{en|1=An animation showing the Fourier synthesis of a square wave with the first 15 approximations of the Fourier series. Below a frequency domain analysis for the current approximation is displayed.}} {{de|1=Die Animation zeig |
You cannot overwrite this file.
File usage on Commons
There are no pages that use this file.
File usage on other wikis
The following other wikis use this file:
- Usage on de.wikipedia.org
- Usage on fr.wikiversity.org
- Usage on hu.wikipedia.org
- Usage on it.wikipedia.org
