File:20211228 Cumulative greenhouse gas emissions by country and region - bar chart.svg

Original file (SVG file, nominally 1,200 × 675 pixels, file size: 6 KB)
Captions
Captions
Summary[edit]
| Description |
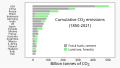
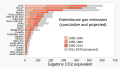
English: *Bar chart of cumulative greenhouse gas emissions by country and region
|
| Date | |
| Source | Own work |
| Author | RCraig09 |
Related files[edit]
The following files relate to cumulative greenhouse gas emissions, some by country, some grouped by region:
-
 20211228 Cumulative greenhouse gas emissions by country and region - bar chart TR.svg (Turkish)
 -
 20211026 Cumulative carbon dioxide CO2 emissions by country - bar chart.svg
 -
 20211228 Cumulative greenhouse gas emissions by country and region - bar chart.svg
 -
 1850-2019 Cumulative greenhouse gas emissions by region - bar chart - IPCC AR6 WG3 - Fig SPM.2b.svg


Raw data[edit]
Uploader determined data values by physically measuring extent of bars in source's bar chart, and used Microsft Excel to convert to the following values that are represented in the above graphic.
Aside: so many significant digits are generated as an unintended result of Microsoft Excel's calculations; actual precision is much less than the following numbers indicate!
| Click at right to show/hide raw data |
|---|
|
VERSION 1 (28 Dec 2021): A B C D Total
1850-1949 1950-1989 1990-2010 2011-2030 Sum of 3 columns only
|
Licensing[edit]
- You are free:
- to share – to copy, distribute and transmit the work
- to remix – to adapt the work
- Under the following conditions:
- attribution – You must give appropriate credit, provide a link to the license, and indicate if changes were made. You may do so in any reasonable manner, but not in any way that suggests the licensor endorses you or your use.
- share alike – If you remix, transform, or build upon the material, you must distribute your contributions under the same or compatible license as the original.
File history
Click on a date/time to view the file as it appeared at that time.
| Date/Time | Thumbnail | Dimensions | User | Comment | |
|---|---|---|---|---|---|
| current | 04:59, 27 September 2023 | | 1,200 × 675 (6 KB) | RCraig09 (talk | contribs) | Version 3: avoid tspan subscripting to work around ongoing SVG text rendering bug . . . . optimize SVG code a bit |
| 20:59, 29 December 2021 |  | 1,200 × 675 (7 KB) | RCraig09 (talk | contribs) | Version 2: changing color of "projected 2011-2030" rectangles to de-emphasize projections in favor of empirically based observations . . . re-ordering countries in order of sum of empirical observations | |
| 20:02, 28 December 2021 |  | 1,200 × 675 (7 KB) | RCraig09 (talk | contribs) | Uploaded own work with UploadWizard |
You cannot overwrite this file.
File usage on Commons
The following 4 pages use this file:
File usage on other wikis
The following other wikis use this file:
- Usage on en.wikipedia.org
- Usage on uk.wikipedia.org