File:2023 Denver mayoral general election turnout map by precinct.svg
Jump to navigation
Jump to search

Size of this PNG preview of this SVG file: 780 × 600 pixels. Other resolutions: 312 × 240 pixels | 625 × 480 pixels | 999 × 768 pixels | 1,280 × 984 pixels | 2,560 × 1,968 pixels | 1,600 × 1,230 pixels.
Original file (SVG file, nominally 1,600 × 1,230 pixels, file size: 432 KB)
Captions
Captions
Add a one-line explanation of what this file represents
Summary[edit]
| Description |
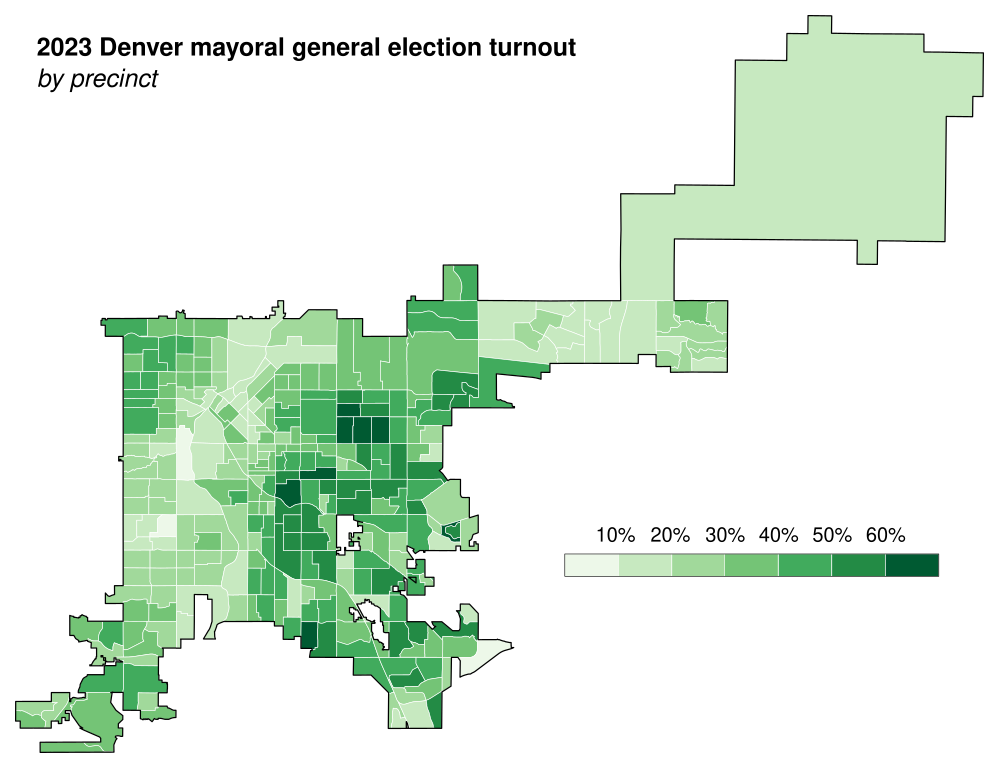
English: Map of the percentage of turnout in the 2023 Denver mayoral general election, with each election precinct coloured in accordance with how many total ballots were cast (including undervotes and overvotes which count as invalid) in proportion to the number of registered voters in the precinct. Election results from the City of Denver. Shapefile from the City of Denver). Map made with MS Excel, Mapshaper, and Inkscape. |
| Date | |
| Source | Own work |
| Author | Twotwofourtysix |
Licensing[edit]
I, the copyright holder of this work, hereby publish it under the following license:
This file is licensed under the Creative Commons Attribution 4.0 International license.
- You are free:
- to share – to copy, distribute and transmit the work
- to remix – to adapt the work
- Under the following conditions:
- attribution – You must give appropriate credit, provide a link to the license, and indicate if changes were made. You may do so in any reasonable manner, but not in any way that suggests the licensor endorses you or your use.
File history
Click on a date/time to view the file as it appeared at that time.
| Date/Time | Thumbnail | Dimensions | User | Comment | |
|---|---|---|---|---|---|
| current | 08:40, 16 January 2024 | | 1,600 × 1,230 (432 KB) | Twotwofourtysix (talk | contribs) | Uploaded own work with UploadWizard |
You cannot overwrite this file.
File usage on Commons
The following page uses this file:
File usage on other wikis
The following other wikis use this file:
- Usage on en.wikipedia.org