File:Bartl.png
Jump to navigation
Jump to search

Size of this preview: 800 × 533 pixels. Other resolutions: 320 × 213 pixels | 640 × 427 pixels | 1,024 × 683 pixels | 1,500 × 1,000 pixels.
Original file (1,500 × 1,000 pixels, file size: 49 KB, MIME type: image/png)
Captions
Captions
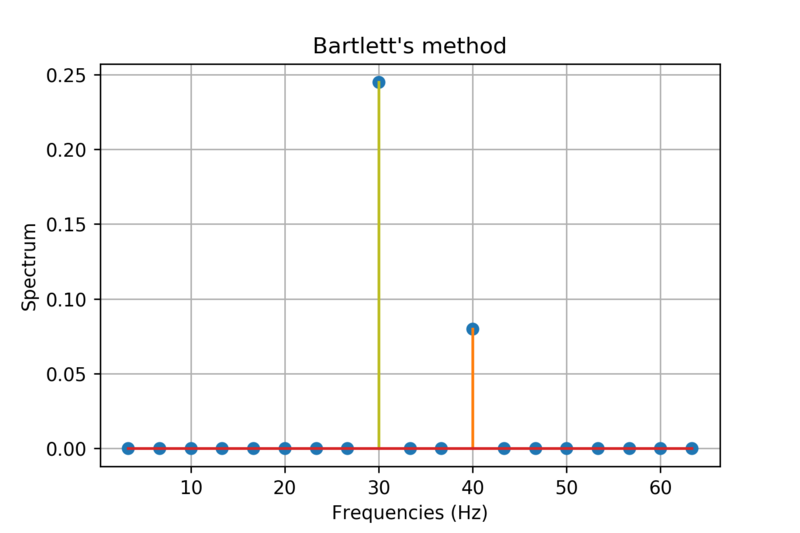
The linear spectrum calculated by the Bartlett's method.
Summary[edit]
| Description |
English: Developed according to [1]. |
|||
| Date | ||||
| Source | Own work | |||
| Author | Kirlf | |||
| Other versions |
|
|||
| PNG development | This plot was created with Matplotlib. | |||
| Source code | Python codeimport numpy as np
from scipy import signal
import matplotlib.pyplot as plt
Nsub = 100 # number of subsequences
w_1 = 30 # frequency of the 1st component of the signal (Hz)
w_2 = 40 # frequency of the 2nd component of the signal (Hz)
a = 0.7 # magnitude of the 1st component of the signal
b = 0.4 # magnitude of the 2nd component of the signal
t = np.array([i for i in range(1,301)])/1000 # time samples (s)
fs = 1 / (t[1]-t[0]) # sampling frequency (Hz)
x = a*np.cos(2*np.pi*w_1*t) + b*np.sin(2*np.pi*w_2*t) # considered signal
y_mat = np.dot(np.ones((Nsub, 1)), x.reshape((1, len(x)))) # assume that subsequences are identical
Pxx = np.empty((Nsub, int((len(x)/2)+1)))
for i in range(np.shape(y_mat)[0]):
y_mat[i,:] = y_mat[i,:] # + 2*np.random.randn(len(t))
f, Pxx[i,:] = signal.periodogram(y_mat[i,:],\
fs=fs, scaling='spectrum')
Pxx_bart = np.mean(Pxx, axis=0)
plt.subplots(1, 1, figsize=(6, 4), dpi=250)
plt.stem(f[1:20], Pxx_bart[1:20], '-')#, linewidth=2, color='b')
plt.ylabel('Spectrum')
plt.xlabel('Frequencies (Hz)')
plt.title('Bartlett\'s method')
plt.grid(True)
plt.show()
|


Licensing[edit]
I, the copyright holder of this work, hereby publish it under the following license:
This file is licensed under the Creative Commons Attribution-Share Alike 4.0 International license.
- You are free:
- to share – to copy, distribute and transmit the work
- to remix – to adapt the work
- Under the following conditions:
- attribution – You must give appropriate credit, provide a link to the license, and indicate if changes were made. You may do so in any reasonable manner, but not in any way that suggests the licensor endorses you or your use.
- share alike – If you remix, transform, or build upon the material, you must distribute your contributions under the same or compatible license as the original.
- ↑ Hayes, Monson H. Statistical digital signal processing and modeling. John Wiley & Sons, 2009. - p. 412-415
File history
Click on a date/time to view the file as it appeared at that time.
| Date/Time | Thumbnail | Dimensions | User | Comment | |
|---|---|---|---|---|---|
| current | 12:03, 19 February 2019 | | 1,500 × 1,000 (49 KB) | Kirlf (talk | contribs) | User created page with UploadWizard |
You cannot overwrite this file.
File usage on Commons
There are no pages that use this file.