File:Bayesian-categorical-mixture.svg
Jump to navigation
Jump to search

Size of this PNG preview of this SVG file: 231 × 211 pixels. Other resolutions: 263 × 240 pixels | 526 × 480 pixels | 841 × 768 pixels | 1,121 × 1,024 pixels | 2,242 × 2,048 pixels.
Original file (SVG file, nominally 231 × 211 pixels, file size: 22 KB)
Captions
Captions
Add a one-line explanation of what this file represents
Summary[edit]
| Description |
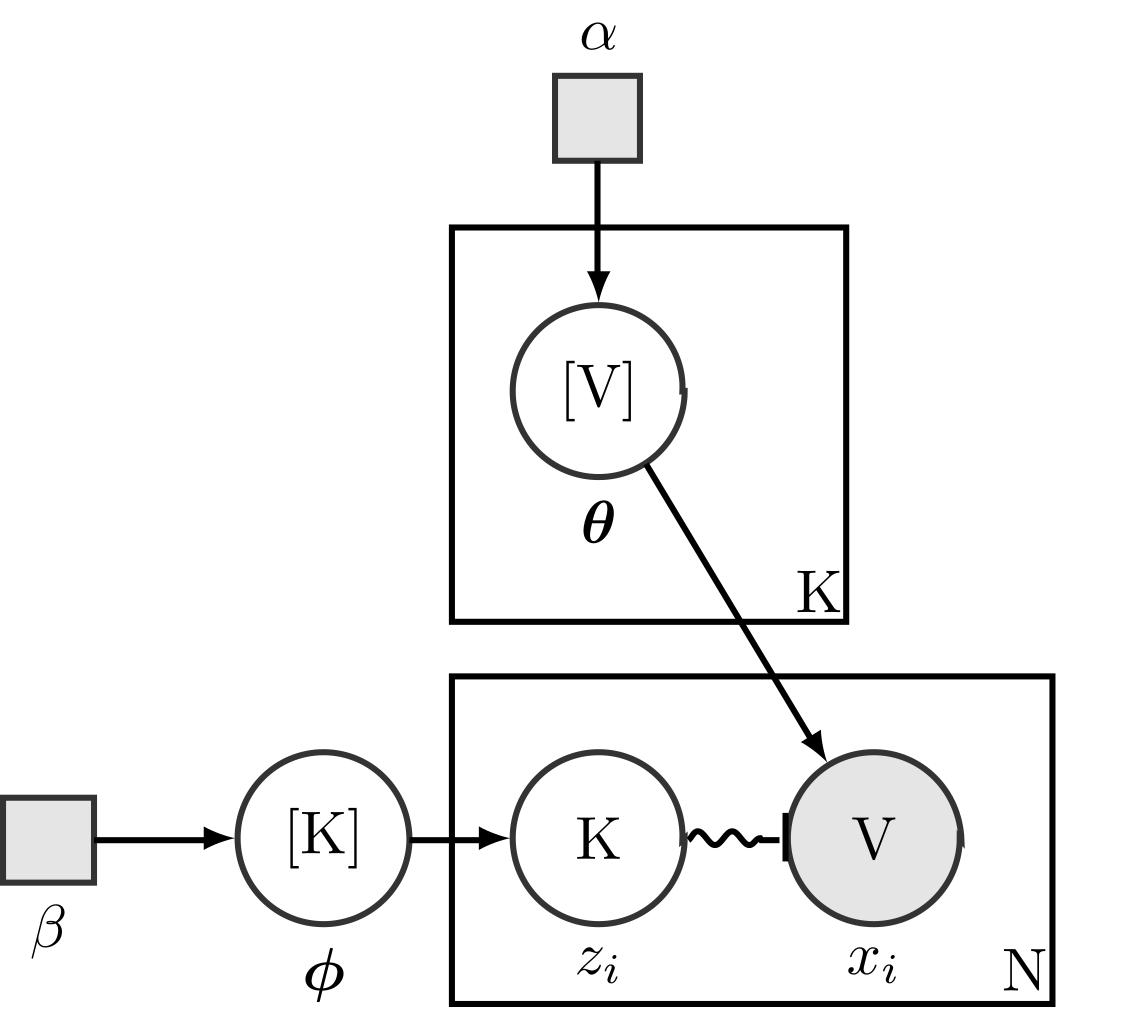
English: Plate diagram of graphical Bayesian Gaussian mixture model.
Created using the following LaTeX, TikZ:
|
||
| Date | |||
| Source | Created using LaTeX, TikZ | ||
| Author | Benwing | ||
| SVG development | |||
| SVG development |
Licensing[edit]
I, the copyright holder of this work, hereby publish it under the following licenses:

|
Permission is granted to copy, distribute and/or modify this document under the terms of the GNU Free Documentation License, Version 1.2 or any later version published by the Free Software Foundation; with no Invariant Sections, no Front-Cover Texts, and no Back-Cover Texts. A copy of the license is included in the section entitled GNU Free Documentation License. |
This file is licensed under the Creative Commons Attribution 3.0 Unported license.
- You are free:
- to share – to copy, distribute and transmit the work
- to remix – to adapt the work
- Under the following conditions:
- attribution – You must give appropriate credit, provide a link to the license, and indicate if changes were made. You may do so in any reasonable manner, but not in any way that suggests the licensor endorses you or your use.
You may select the license of your choice.
File history
Click on a date/time to view the file as it appeared at that time.
| Date/Time | Thumbnail | Dimensions | User | Comment | |
|---|---|---|---|---|---|
| current | 09:42, 2 April 2012 | | 231 × 211 (22 KB) | Benwing (talk | contribs) | update for new format for categorical and switching nodes |
| 05:19, 2 April 2012 |  | 231 × 211 (21 KB) | Benwing (talk | contribs) | == {{int:filedesc}} == {{Information |description = {{en|1=Plate diagram of graphical Bayesian Gaussian mixture model. Created using the following LaTeX, TikZ: {{cot|Source Code}} <source lang="latex"> \documentclass{article} \usepackage{tikz,amsmath} ... |
You cannot overwrite this file.
File usage on Commons
There are no pages that use this file.
File usage on other wikis
The following other wikis use this file:
- Usage on ar.wikipedia.org
- Usage on en.wikipedia.org
- Usage on ko.wikipedia.org