File:Binomial confidence band.svg
Jump to navigation
Jump to search

Size of this PNG preview of this SVG file: 720 × 540 pixels. Other resolutions: 320 × 240 pixels | 640 × 480 pixels | 1,024 × 768 pixels | 1,280 × 960 pixels | 2,560 × 1,920 pixels.
Original file (SVG file, nominally 720 × 540 pixels, file size: 43 KB)
Captions
Captions
Add a one-line explanation of what this file represents
Summary[edit]
| Description |
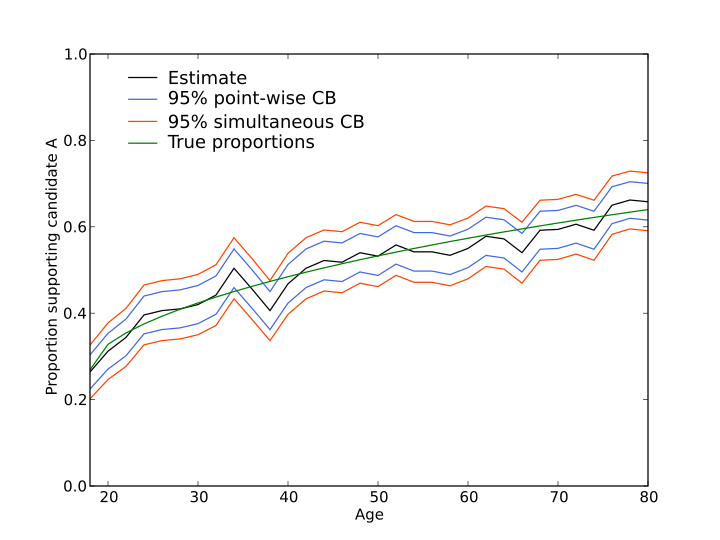
English: Illustration of confidence bands using simulated data. |
| Date | |
| Source |
Own work |
| Author | Skbkekas |
| Other versions |
[]
|
| SVG development | This plot was created with Matplotlib. |
| Source code | Python codeimport numpy as np
import matplotlib.pyplot as plt
import scipy.special as sp
X = np.arange(18, 81, 2)
P = 1/(1+np.exp(1-0.2*np.sqrt(X-18)))
Y,S,n = [],[],500
for i,x in enumerate(X):
y = 1*(np.random.uniform(size=n)<P[i])
p = y.mean()
Y.append(p)
S.append(np.sqrt(p*(1-p)/n))
Y = np.array(Y)
S = np.array(S)
## Multiplier for 95% simultaneous confidence band using Bonferroni method.
f = -sp.ndtri(0.025/len(P))
plt.clf()
a = plt.plot(X, Y, '-', color='black')
plt.hold(True)
b = plt.plot(X, Y+2*S, '-', color='royalblue')
plt.plot(X, Y-2*S, '-', color='royalblue')
c = plt.plot(X, Y+f*S, '-', color='orangered')
plt.plot(X, Y-f*S, '-', color='orangered')
d = plt.plot(X, P, '-', color='green')
plt.ylim(0,1)
plt.xlim(18,80)
B = plt.legend((a,b,c,d), ('Estimate', '95% point-wise CB',\
'95% simultaneous CB', "True proportions"),\
'upper left')
B.draw_frame(False)
plt.xlabel("Age")
plt.ylabel("Proportion supporting candidate A")
plt.savefig("binomial_confidence_band.png")
plt.savefig("binomial_confidence_band.svg")
|


Licensing[edit]
I, the copyright holder of this work, hereby publish it under the following license:
This file is licensed under the Creative Commons Attribution 3.0 Unported license.
- You are free:
- to share – to copy, distribute and transmit the work
- to remix – to adapt the work
- Under the following conditions:
- attribution – You must give appropriate credit, provide a link to the license, and indicate if changes were made. You may do so in any reasonable manner, but not in any way that suggests the licensor endorses you or your use.
File history
Click on a date/time to view the file as it appeared at that time.
| Date/Time | Thumbnail | Dimensions | User | Comment | |
|---|---|---|---|---|---|
| current | 04:11, 11 April 2009 | | 720 × 540 (43 KB) | Skbkekas (talk | contribs) | Added the line for true proportions. |
| 04:02, 11 April 2009 |  | 720 × 540 (41 KB) | Skbkekas (talk | contribs) | {{Information |Description={{en|1=Illustration of confidence bands using simulated data.}} |Source=Own work by uploader |Author=Skbkekas |Date=April 11, 2009 |Permission= |other_versions= }} <!--{{ImageUpload|full}}--> |
You cannot overwrite this file.
File usage on Commons
The following 3 pages use this file:
File usage on other wikis
The following other wikis use this file:
- Usage on en.wikipedia.org
- Usage on www.wikidata.org