File:Carbon History and Flux.png
Carbon_History_and_Flux.png (477 × 600 pixels, file size: 23 KB, MIME type: image/png)
Captions
Captions
Summary[edit]

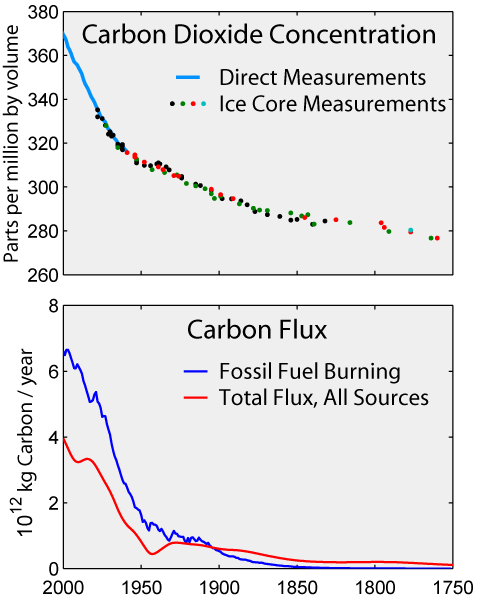
The upper image shows the carbon dioxide concentration in the atmosphere over the last 250 years based on both direct atmospheric measurements and sampling of gases trapped in ice cores.
The bottom image shows the rate of change of the abundance of carbon dioxide in the atmosphere expressed as 1012 kg carbon per year (also known as gigatonnes carbon (GtC) per year). A comparison is shown between the "Total Flux" needed to explain the observed changes in atmospheric carbon dioxide content and the estimated flux of carbon generated from fossil fuel burning (Marland et al. 2003). Since ~1900, the flux of carbon entering the atmosphere from fossil fuel consumption has exceeded the net flux of carbon from all sources, indicated that the sum of all other impacts on the carbon cycle has been acting as a net sink, and serving to sequester some of the carbon being released from fossil fuel consumption. Dissolving into the oceans and increases in biological productivity are likely sinks for removing some of the contributed carbon dioxide.
The net flux of carbon into the atmosphere before the rise of fossil fuel burning may be a natural fluctuation or it may also be related to human activities such as the clearing of forests or changes agriculture during the first industrial revolution. As seen at right, the modest changes from ~1750-1850 are largely within the margin of natural variability, but the subsequent accummulation of carbon dioxide far exceeds any concentration witnessed in the last 400,000 years and may have not occurred over the last tens of millions of years.
Copyright[edit]
This image was constructed by Robert A. Rohde from publicly available data and is incorporated into the Global Warming Art project.

|
Permission is granted to copy, distribute and/or modify this document under the terms of the GNU Free Documentation License, Version 1.2 or any later version published by the Free Software Foundation; with no Invariant Sections, no Front-Cover Texts, and no Back-Cover Texts. A copy of the license is included in the section entitled GNU Free Documentation License. |
| This file is licensed under the Creative Commons Attribution-Share Alike 3.0 Unported license. | ||
| ||
| This licensing tag was added to this file as part of the GFDL licensing update. |
Methodology[edit]
The curve for "Total Flux" was constructed from the measured changes in atmospheric carbon dioxide content by locally fitting the slope of the curve to a line. A gradually varying Gaussian window was used such that for each interval of time approximately 10-15 pts were used to define the slope. This was coverted to a flux via the scale factor 21.4 GtC / ppmv derived from the mass of the atmosphere and similar terms. This calculation carries a 5-10% uncertainty primarily related to uncertainty in the total mass of the atmosphere.
References[edit]
Measured carbon concentrations[edit]
- Keeling, C.D. and T.P. Whorf (2004) "Atmospheric CO2 records from sites in the SIO air sampling network" in Trends: A Compendium of Data on Global Change. Carbon Dioxide Information Analysis Center, Oak Ridge National Laboratory, U.S. Department of Energy, Oak Ridge, Tenn., U.S.A.
Ice core data[edit]
- D.M. Etheridge, L.P. Steele, R.L. Langenfelds, R.J. Francey, J.-M. Barnola and V.I. Morgan (1998) "Historical CO2 records from the Law Dome DE08, DE08-2, and DSS ice cores" in Trends: A Compendium of Data on Global Change. Carbon Dioxide Information Analysis Center, Oak Ridge National Laboratory, U.S. Department of Energy, Oak Ridge, Tenn., U.S.A.
- Neftel, A., H. Friedli, E. Moor, H. Lötscher, H. Oeschger, U. Siegenthaler, and B. Stauffer (1994) "Historical CO2 record from the Siple Station ice core" in Trends: A Compendium of Data on Global Change. Carbon Dioxide Information Analysis Center, Oak Ridge National Laboratory, U.S. Department of Energy, Oak Ridge, Tenn., U.S.A.
- Monnin, E., E.J. Steig, U. Siegenthaler, K. Kawamura, J. Schwander, B. Stauffer, T.F. Stocker, D.L. Morse, J.-M. Barnola, B. Bellier, D. Raynaud, and H. Fischer (2004). "Evidence for substantial accumulation rate variability in Antarctica during the Holocene, through synchronization of CO2 in the Taylor Dome, Dome C and DML ice cores". Earth and Planetary Science Letters 224: 45-54. doi:10.1016/j.epsl.2004.05.007
Fossil fuel carbon flux[edit]
- Marland, G., T.A. Boden, and R. J. Andres. 2003. "Global, Regional, and National CO2 Emissions." In Trends: A Compendium of Data on Global Change. Carbon Dioxide Information Analysis Center, Oak Ridge National Laboratory, U.S. Department of Energy, Oak Ridge, Tenn., U.S.A. [1] archive copy at the Wayback Machine
File history
Click on a date/time to view the file as it appeared at that time.
| Date/Time | Thumbnail | Dimensions | User | Comment | |
|---|---|---|---|---|---|
| current | 06:43, 10 April 2006 | | 477 × 600 (23 KB) | Pflatau (talk | contribs) | == Description == thumb|right|300px|Carbon dioxide change during the last 400,000 years with an inset image of carbon dioxide change for the last 1000 years. This image has been superseded by [http://en.wikipedia.org |
You cannot overwrite this file.
File usage on Commons
The following page uses this file:
File usage on other wikis
The following other wikis use this file:
- Usage on en.wikipedia.org