File:Clune2016 food lca.svg
Jump to navigation
Jump to search

Size of this PNG preview of this SVG file: 750 × 600 pixels. Other resolutions: 300 × 240 pixels | 600 × 480 pixels | 960 × 768 pixels | 1,280 × 1,024 pixels | 2,560 × 2,048 pixels | 1,000 × 800 pixels.
Original file (SVG file, nominally 1,000 × 800 pixels, file size: 49 KB)
Captions
Captions
Add a one-line explanation of what this file represents
Summary[edit]
| Description |
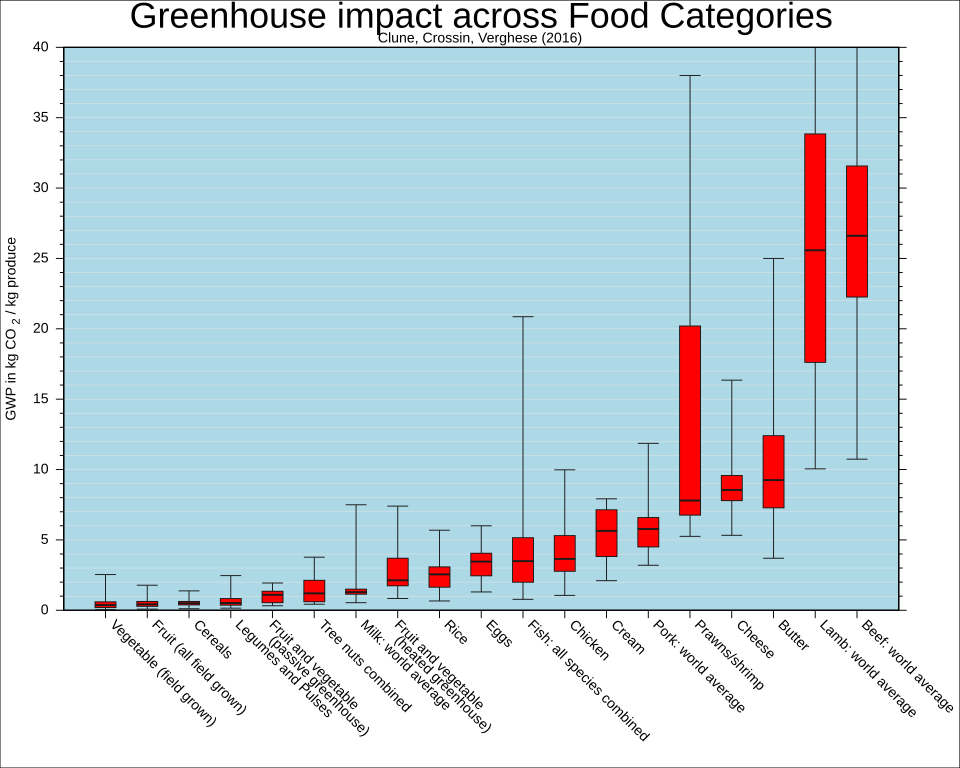
English: Global Warming Potential of Food Categories. Values are from a systematic review of Life Cycle Assessment studies of various food products. Boxes represent: Q1-Q3 of the values, candlesticks: Min-Max,vertical line: median.
The data is from table 4 of Stephen Clune, Enda Crossin, Karli Verghese: Systematic review of greenhouse gas emissions for different fresh food categories. In: Journal of Cleaner Production. 2016. DOI: 10.1016/j.jclepro.2016.04.082
Deutsch: Treibhauspotential von Lebensmittelgruppen. Die Werte stammen aus einer systamtischen Übersicht einer Vielzahl von Lebenszyklusanalysen. Balken stellen Q1-Q3 der gefundenen Werte dar, Stifte Min-Max, die vertikale Linie den Median.
Daten aus Tabelle 4 in: Stephen Clune, Enda Crossin, Karli Verghese: Systematic review of greenhouse gas emissions for different fresh food categories. In: Journal of Cleaner Production. 2016. DOI: 10.1016/j.jclepro.2016.04.082 |
| Date | |
| Source | Own work |
| Author | DeWikiMan |
| Other versions | File:Clune2016 food lca-de.svg (German language version) |
Then the plot has been created by copying the data of Clune et. al (2016), Table 4, into a colon separated text file and adding the row number as the first column
#nr;name;mean;median;stddev;deviation from mean;min;max;Q1;Q3;No of LCA studies;No. of GWP values
1;Vegetable (field grown);0.37;0.47;0.39;83%;0.04;2.54;0.19;0.60;33;140
2;Fruit (all field grown);0.42;0.50;0.32;64%;0.08;1.78;0.28;0.63;77;250
3;Cereals;0.50;0.53;0.22;42%;0.11;1.38;0.38;0.63;31;90
4;Legumes and Pulses;0.51;0.66;0.45;67%;0.15;2.46;0.36;0.83;16;51
5;Fruit and vegetable\n(passive greenhouse);1.10;1.02;0.49;48%;0.32;1.94;0.54;1.35;5;15
6;Tree nuts combined;1.20;1.42;0.93;66%;0.43;3.77;0.61;2.13;7;21
7;Milk: world average;1.29;1.39;0.58;41%;0.54;7.50;1.14;1.50;77;262
8;Fruit and vegetable\n(heated greenhouse);2.13;2.81;1.61;57%;0.84;7.4;1.74;3.7;18;53
9;Rice;2.55;2.66;1.29;48%;0.66;5.69;1.64;3.08;12;27
10;Eggs;3.46;3.39;1.21;36%;1.30;6.00;2.45;4.05;19;38
11;Fish: all species combined;3.49;4.41;3.62;82%;0.78;20.86;1.99;5.16;47;148
12;Chicken;3.65;4.12;1.72;42%;1.06;9.98;2.77;5.31;29;95
13;Cream;5.64;5.32;1.62;31%;2.10;7.92;3.82;7.14;3;4
14;Pork: world average;5.77;5.85;1.63;28%;3.20;11.86;4.50;6.59;38;130
15;Prawns/shrimp;7.80;14.85;12.37;83%;5.25;38.00;6.76;20.20;7;11
16;Cheese;8.55;8.86;2.07;23%;5.33;16.35;7.79;9.58;22;38
17;Butter;9.25;11.52;7.37;64%;3.70;25.00;7.28;12.41;4;8
18;Lamb: world average;25.58;27.91;11.93;43%;10.05;56.70;17.61;33.85;22;56
19;Beef: world average;26.61;28.73;12.47;43%;10.74;109.5;22.26;31.57;49;165
and then running the following script with Gnuplot 4.4:
set terminal svg enhanced size 1000 800 fname "Liberation Sans" fsize 11
set output "Clune2016_food_lca.svg"
set title "Greenhouse impact across Food Categories"  font "Liberation Sans, 28"
set datafile missing '"#N/A"'
set datafile separator ";"
set nokey
set label 'Clune, Crossin, Verghese (2016)' at screen 0.5,0.95 center
set obj 1 rectangle behind from screen 0,0 to screen 1,1
set obj 1 fillstyle solid 1.0 fillcolor rgbcolor "white"
set obj 2 rectangle behind from graph 0,0 to graph 1,1
set obj 2 fillstyle solid 1.0 fillcolor rgbcolor "light-blue"

set grid noxtics ytics mytics lt 0 lw 0.5 lc rgb "grey90"
set yrange [0:40]
set xrange [0:20]
set xtics out nomirror rotate by -45
set ytics out mirror 0,5,40
set mytics 5
set ylabel 'GWP in kg CO_2 / kg produce'
set boxwidth 0.5
set style fill solid 1.0 border rgb 'grey10'

plot "clune2016_foodlca_table4.txt" using 1:9:8:7:10:xticlabels(2)  linecolor rgb "red30" with candlesticks whiskerbars, \
     "clune2016_foodlca_table4.txt" using 1:3:3:3:3 with candlesticks lt -1 lw 2 notitle
Licensing[edit]
I, the copyright holder of this work, hereby publish it under the following licenses:

|
Permission is granted to copy, distribute and/or modify this document under the terms of the GNU Free Documentation License, Version 1.2 or any later version published by the Free Software Foundation; with no Invariant Sections, no Front-Cover Texts, and no Back-Cover Texts. A copy of the license is included in the section entitled GNU Free Documentation License. |
This file is licensed under the Creative Commons Attribution-Share Alike 4.0 International, 3.0 Unported, 2.5 Generic, 2.0 Generic and 1.0 Generic license.
- You are free:
- to share – to copy, distribute and transmit the work
- to remix – to adapt the work
- Under the following conditions:
- attribution – You must give appropriate credit, provide a link to the license, and indicate if changes were made. You may do so in any reasonable manner, but not in any way that suggests the licensor endorses you or your use.
- share alike – If you remix, transform, or build upon the material, you must distribute your contributions under the same or compatible license as the original.
You may select the license of your choice.
File history
Click on a date/time to view the file as it appeared at that time.
| Date/Time | Thumbnail | Dimensions | User | Comment | |
|---|---|---|---|---|---|
| current | 11:32, 8 October 2016 | | 1,000 × 800 (49 KB) | DeWikiMan (talk | contribs) | colors added; labels changed to improve readability |
| 23:19, 7 October 2016 |  | 1,000 × 800 (48 KB) | DeWikiMan (talk | contribs) | white background | |
| 22:45, 7 October 2016 |  | 1,000 × 800 (48 KB) | DeWikiMan (talk | contribs) | year fixed | |
| 22:22, 7 October 2016 |  | 1,000 × 800 (48 KB) | DeWikiMan (talk | contribs) | {{Information |Description ={{en|1=Global Warming Potential of Food Categories. Values are from a systematic review of Life Cycle Assessment studies of various food products. Boxes represent: Q1-Q3 of the values, candlesticks: Min-Max,vertical line:... |
You cannot overwrite this file.
File usage on Commons
There are no pages that use this file.
File usage on other wikis
The following other wikis use this file:
- Usage on cs.wikipedia.org
- Usage on el.wikipedia.org
- Usage on en.wikipedia.org
- Usage on es.wikipedia.org
- Usage on ha.wikipedia.org
- Usage on ig.wiktionary.org