File:Correctional Populations in the United States 1980-2008.png
Jump to navigation
Jump to search
Size of this preview: 800 × 324 pixels. Other resolutions: 320 × 130 pixels | 640 × 259 pixels | 1,024 × 415 pixels | 1,922 × 778 pixels.
Original file (1,922 × 778 pixels, file size: 17 KB, MIME type: image/png)
Captions
Captions
Add a one-line explanation of what this file represents
Summary[edit]
| Description |
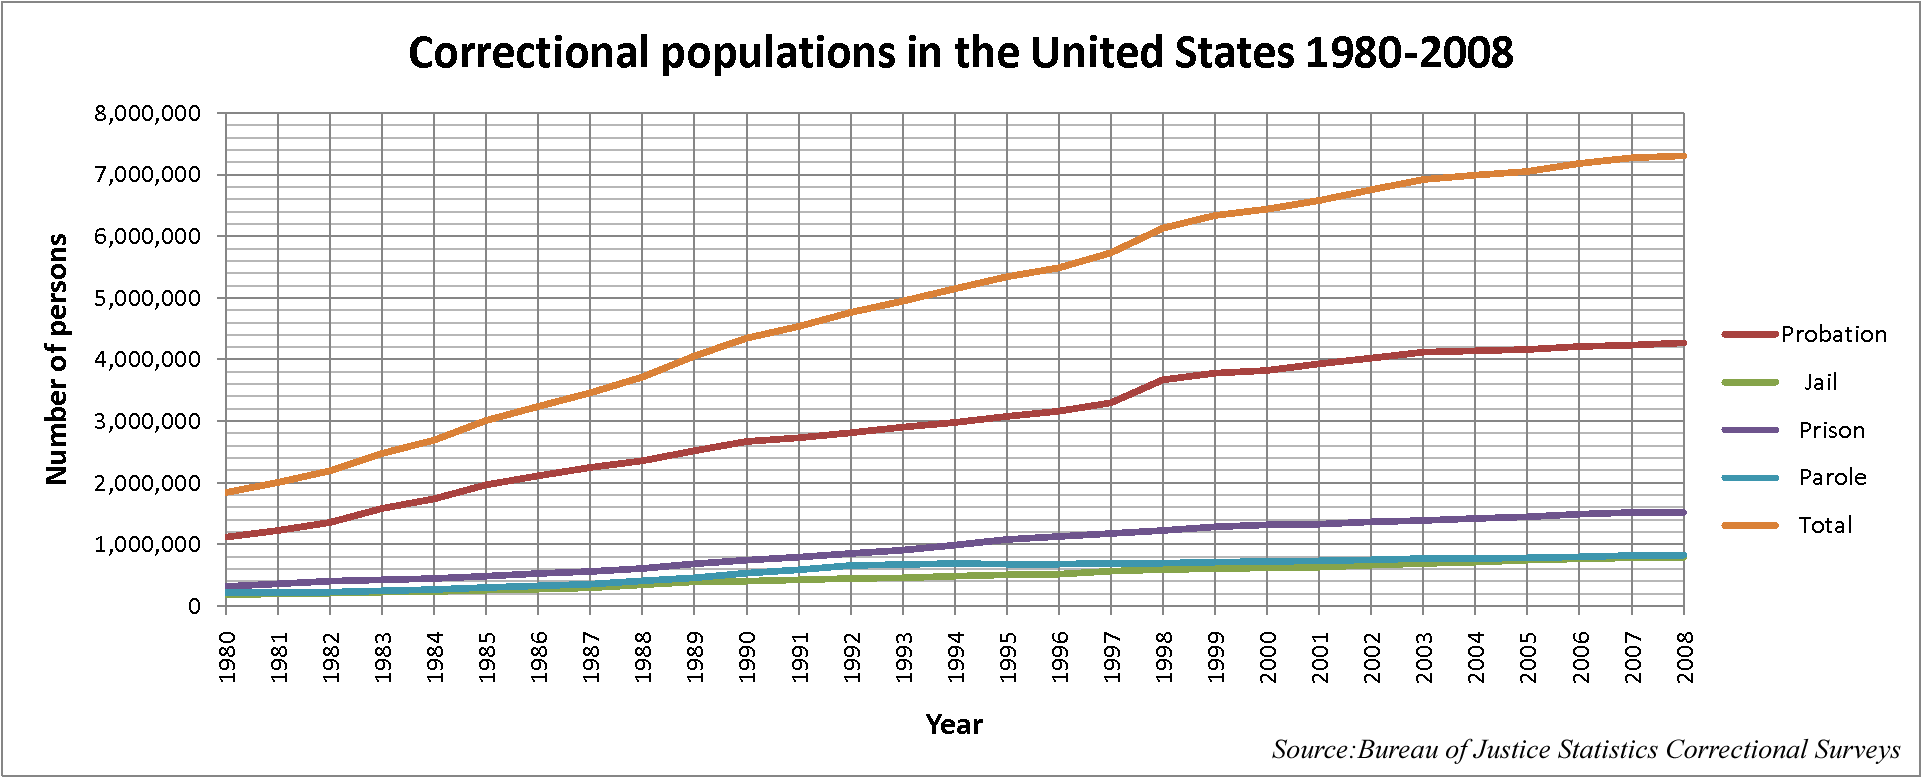
English: A graph that shows the Correctional populations in the United States from 1980 to 2008. It shows probation, jail, prison, and parole correlations. The data table is below. |
| Date | |
| Source |
I (Smallman12q (talk)) created this graph using the data found at [1] The data is released under the Bureau of Justice Statistics from the Bureau of Justice Statistics Correctional Surveys by Lauren Glaze, Todd Minton, and Heather West on 12/08/09.
|
| Author | Smallman12q at en.wikipedia |
| Other versions | w:File:Correctional Populations in the United States 1980-2008.pdf-pdf version for scaling. |
| Year | Probation | Jail | Prison | Parole | Total |
| 1980 | 1118097 | 183988 | 319598 | 220438 | 1842100 |
| 1981 | 1225934 | 196785 | 360029 | 225539 | 2008300 |
| 1982 | 1357264 | 209582 | 402914 | 224604 | 2194400 |
| 1983 | 1582947 | 223551 | 423898 | 246440 | 2476800 |
| 1984 | 1740948 | 234500 | 448264 | 266992 | 2690700 |
| 1985 | 1968712 | 256615 | 487593 | 300203 | 3013100 |
| 1986 | 2114621 | 274444 | 526436 | 325638 | 3241100 |
| 1987 | 2247158 | 295873 | 562814 | 355505 | 3461400 |
| 1988 | 2356483 | 343569 | 607766 | 407977 | 3715800 |
| 1989 | 2522125 | 395553 | 683367 | 456803 | 4057800 |
| 1990 | 2670234 | 405320 | 743382 | 531407 | 4350300 |
| 1991 | 2728472 | 426479 | 792535 | 590442 | 4537900 |
| 1992 | 2811611 | 444584 | 850566 | 658601 | 4765400 |
| 1993 | 2903061 | 459804 | 909381 | 676100 | 4948300 |
| 1994 | 2981022 | 486474 | 990147 | 690371 | 5148000 |
| 1995 | 3077861 | 507044 | 1078542 | 679421 | 5342900 |
| 1996 | 3164996 | 518492 | 1127528 | 679733 | 5490700 |
| 1997 | 3296513 | 567079 | 1176564 | 694787 | 5734900 |
| 1998 | 3670441 | 592462 | 1224469 | 696385 | 6134200 |
| 1999 | 3779922 | 605943 | 1287172 | 714457 | 6340800 |
| 2000 | 3826209 | 621149 | 1316333 | 723898 | 6445100 |
| 2001 | 3931731 | 631240 | 1330007 | 732333 | 6581700 |
| 2002 | 4024067 | 665475 | 1367547 | 750934 | 6758800 |
| 2003 | 4120012 | 691301 | 1390279 | 769925 | 6924500 |
| 2004 | 4143792 | 713990 | 1421345 | 771852 | 6995000 |
| 2005 | 4166757 | 747529 | 1448344 | 780616 | 7051900 |
| 2006 | 4215361 | 765819 | 1492973 | 799875 | 7182100 |
| 2007 | 4234471 | 780174 | 1517867 | 821177 | 7274300 |
| 2008 | 4270917 | 785556 | 1518559 | 828169 | 7308200 |
Licensing[edit]
| This work has been released into the public domain by its author, Smallman12q at English Wikipedia. This applies worldwide. In some countries this may not be legally possible; if so: Smallman12q grants anyone the right to use this work for any purpose, without any conditions, unless such conditions are required by law. |
Original upload log[edit]
The original description page was here. All following user names refer to en.wikipedia.
Upload date | User | Bytes | Dimensions | Comment
- 2010-01-05 01:18 (UTC) | Smallman12q | 17220 (bytes) | 1922×778 | {{Information |Description = A graph that shows the Correctional populations in the United States from 1980 to 2008. It shows probation, jail, prison, and parole correlations. |Source = I (~~~) created this graph using the data found at [http
File history
Click on a date/time to view the file as it appeared at that time.
| Date/Time | Thumbnail | Dimensions | User | Comment | |
|---|---|---|---|---|---|
| current | 13:24, 12 December 2011 | 1,922 × 778 (17 KB) | SreeBot (talk | contribs) | (Original text) : {{Information |Description = A graph that shows the Correctional populations in the United States from 1980 to 2008. It shows probation, jail, prison, and parole correlations. |Source = I (~~~) created this graph using the d |
You cannot overwrite this file.
File usage on Commons
There are no pages that use this file.
File usage on other wikis
The following other wikis use this file:
- Usage on en.wikipedia.org
- Usage on pt.wikipedia.org