File:Gemessene COVID-19-Neuinfektionen in Deutschland (kumuliert), Risklayer.svg

Original file (SVG file, nominally 11,018 × 3,250 pixels, file size: 35 KB)
Captions
Captions
Summary[edit]
,_Risklayer.svg&action=edit§ion=1)
| Description |
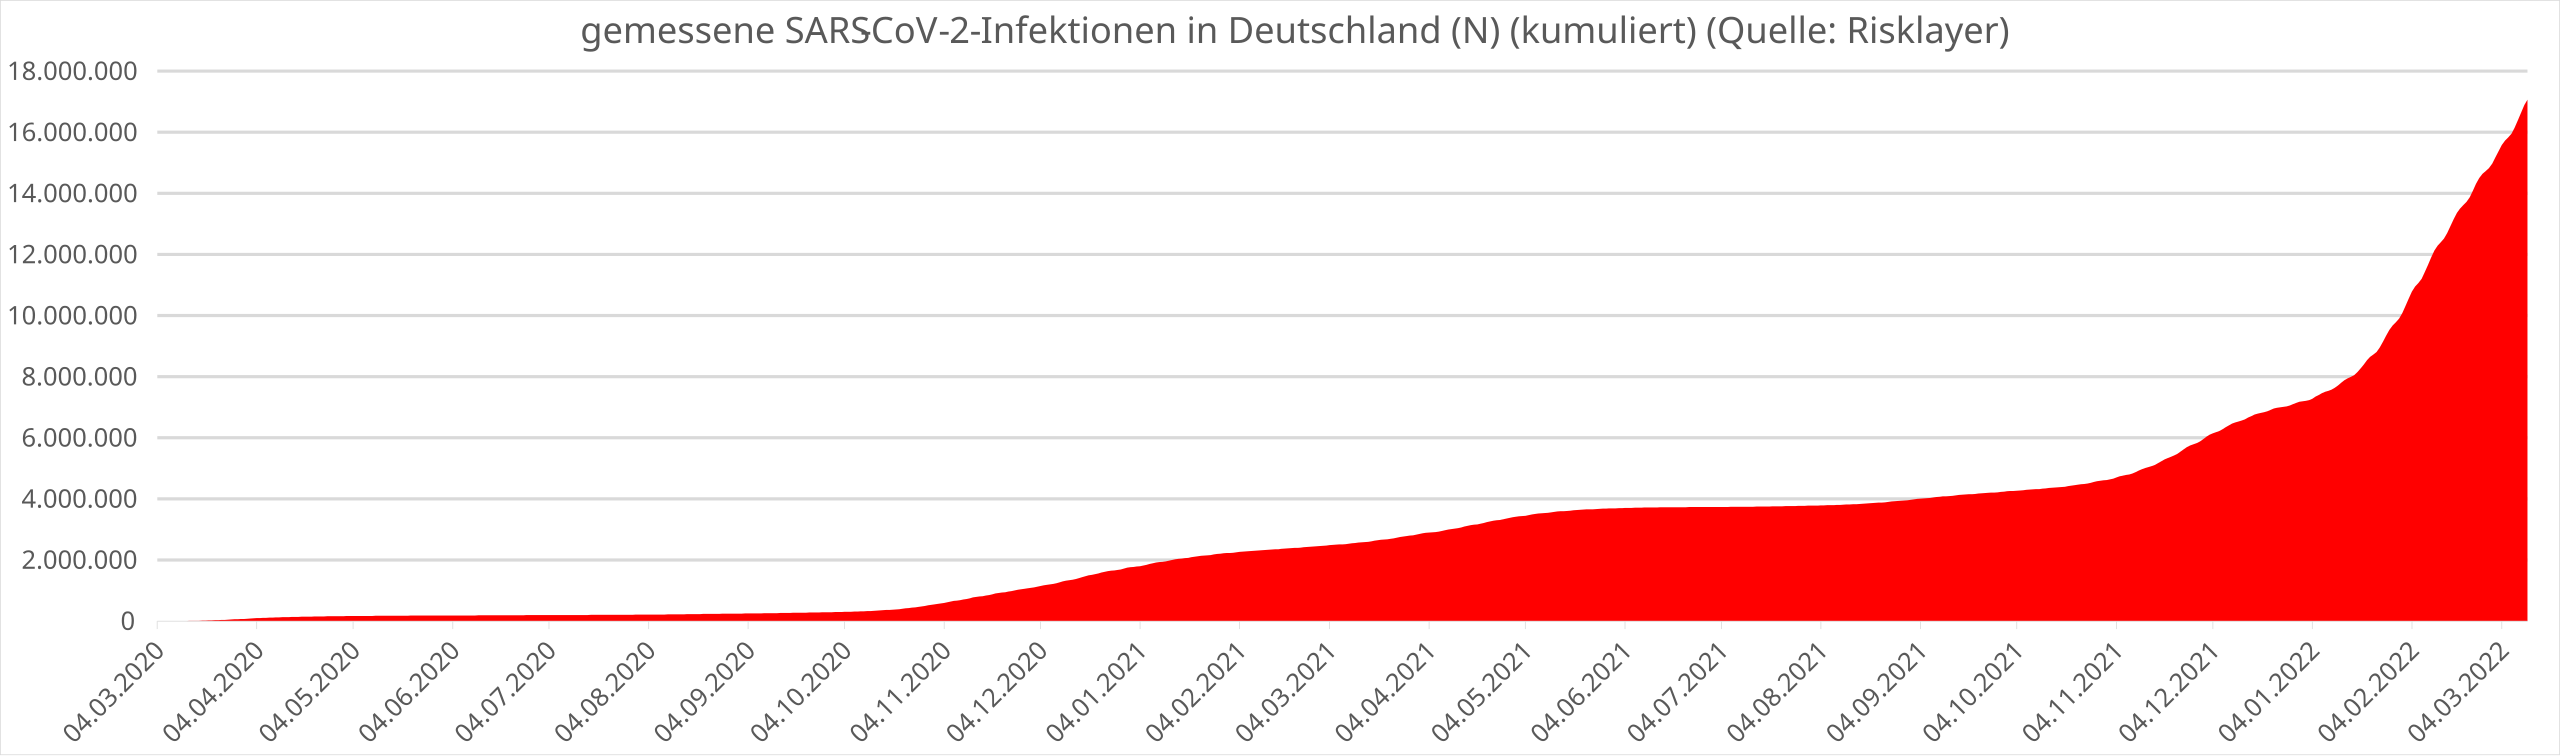
Deutsch: Gemessene COVID-19-Neuinfektionen in Deutschland (kumuliert), Risklayer. Die Skala reicht von Anfang März 2020 bis 14.12.2021. Es ist zu beachten, dass um November 2021/Dezember 2021 die Testlabore teils eine Auslastung von über 100% (max. 150% oder mehr) hatten, nicht alle Infektionen wurden von Gesundheitsämtern angenommen/registriert, es gab viele Nachmeldungen.
English: Measured new COVID-19 infections in Germany (cumulative), Risklayer. The scale ranges from the beginning of March 2020 to 14.12.2021. It should be noted that around November 2021/December 2021, some of the testing laboratories had a utilization of more than 100% (max. 150% or more), not all infections were accepted/registered by health departments, there were many follow-up reports.
|
| Date | |
| Source |
|
| Author | Diagrammgestaltung: PantheraLeo1359531 😺 (talk) / Zahlen von Risklayer: Johannes Brand, James Daniell und andere |
Rohdaten[edit]
,_Risklayer.svg&action=edit§ion=2)
| Rohdaten: |
|---|
|
Datum Fälle (N)
04.03.2020 374 |
Licensing[edit]
,_Risklayer.svg&action=edit§ion=3)
| This file is made available under the Creative Commons CC0 1.0 Universal Public Domain Dedication. | |
| The person who associated a work with this deed has dedicated the work to the public domain by waiving all of their rights to the work worldwide under copyright law, including all related and neighboring rights, to the extent allowed by law. You can copy, modify, distribute and perform the work, even for commercial purposes, all without asking permission.
|
File history
Click on a date/time to view the file as it appeared at that time.
,_Risklayer.svg&dir=prev)
,_Risklayer.svg&offset=20211123152029)
,_Risklayer.svg&offset=&limit=20)
,_Risklayer.svg&offset=&limit=50)
,_Risklayer.svg&offset=&limit=100)
,_Risklayer.svg&offset=&limit=250)
,_Risklayer.svg&offset=&limit=500)
| Date/Time | Thumbnail | Dimensions | User | Comment | |
|---|---|---|---|---|---|
| current | 22:00, 12 March 2022 | 11,018 × 3,250 (35 KB) | PantheraLeo1359531 (talk | contribs) | Stand bis 12.03.2022, ca. +3,9 Mio. | |
| 20:30, 17 February 2022 | 10,730 × 3,250 (34 KB) | PantheraLeo1359531 (talk | contribs) | Stand bis 17.02.2022, ca. +1.953.637, (gemessene Infektionszahl + Dunkelziffer (Faktor 2,3 zu gemessenen Infektionszahlen: 30,25 Mio.) evtl. bei 36,34%. | ||
| 20:58, 6 February 2022 | 10,730 × 3,250 (33 KB) | PantheraLeo1359531 (talk | contribs) | Stand bis 06.02.2022, ca. +1.534.348 | ||
| 21:33, 27 January 2022 | 10,637 × 3,311 (33 KB) | PantheraLeo1359531 (talk | contribs) | Stand bis 27.01.2022, +1.300.000 | ||
| 20:54, 17 January 2022 | 10,397 × 3,311 (32 KB) | PantheraLeo1359531 (talk | contribs) | Stand bis 17.01.2022, ca. +590.000 | ||
| 19:50, 7 January 2022 | 5,601 × 1,656 (32 KB) | PantheraLeo1359531 (talk | contribs) | Stand 07.01.2022, ca. +458.000 | ||
| 20:49, 25 December 2021 | 5,601 × 1,656 (31 KB) | PantheraLeo1359531 (talk | contribs) | Stand bis 25.12.2021, ca. 400000 | ||
| 19:52, 14 December 2021 | 5,601 × 1,656 (31 KB) | PantheraLeo1359531 (talk | contribs) | Stand bis 14.12.2021, ca. +503.000 | ||
| 20:18, 3 December 2021 | 5,471 × 1,656 (30 KB) | PantheraLeo1359531 (talk | contribs) | Stand bis 03.12.2021 | ||
| 15:20, 23 November 2021 | 5,471 × 1,656 (29 KB) | PantheraLeo1359531 (talk | contribs) | Aktualisiert auf Stand 23.11.2021 (23.11. noch laufend) |
You cannot overwrite this file.
File usage on Commons
The following 11 pages use this file:
- User:Ireas/OgreBot/Karlsruhe/2021 December 1-10
- User:Ireas/OgreBot/Karlsruhe/2021 December 11-20
- User:Ireas/OgreBot/Karlsruhe/2021 December 21-31
- User:Ireas/OgreBot/Karlsruhe/2021 November 11-20
- User:Ireas/OgreBot/Karlsruhe/2021 November 21-30
- User:Ireas/OgreBot/Karlsruhe/2022 February 1-9
- User:Ireas/OgreBot/Karlsruhe/2022 February 10-18
- User:Ireas/OgreBot/Karlsruhe/2022 January 1-10
- User:Ireas/OgreBot/Karlsruhe/2022 January 11-20
- User:Ireas/OgreBot/Karlsruhe/2022 January 21-31
- User:Ireas/OgreBot/Karlsruhe/2022 March 11-20
File usage on other wikis
The following other wikis use this file:
- Usage on de.wikipedia.org
,_Risklayer.svg&oldid=659764012)