File:Hot Gas-Giant Exoplanet WASP-43 b (MIRI Phase Curve) (2024-117).jpg
Original file (3,840 × 2,515 pixels, file size: 603 KB, MIME type: image/jpeg)
Captions
Captions
Summary[edit]
| Description |
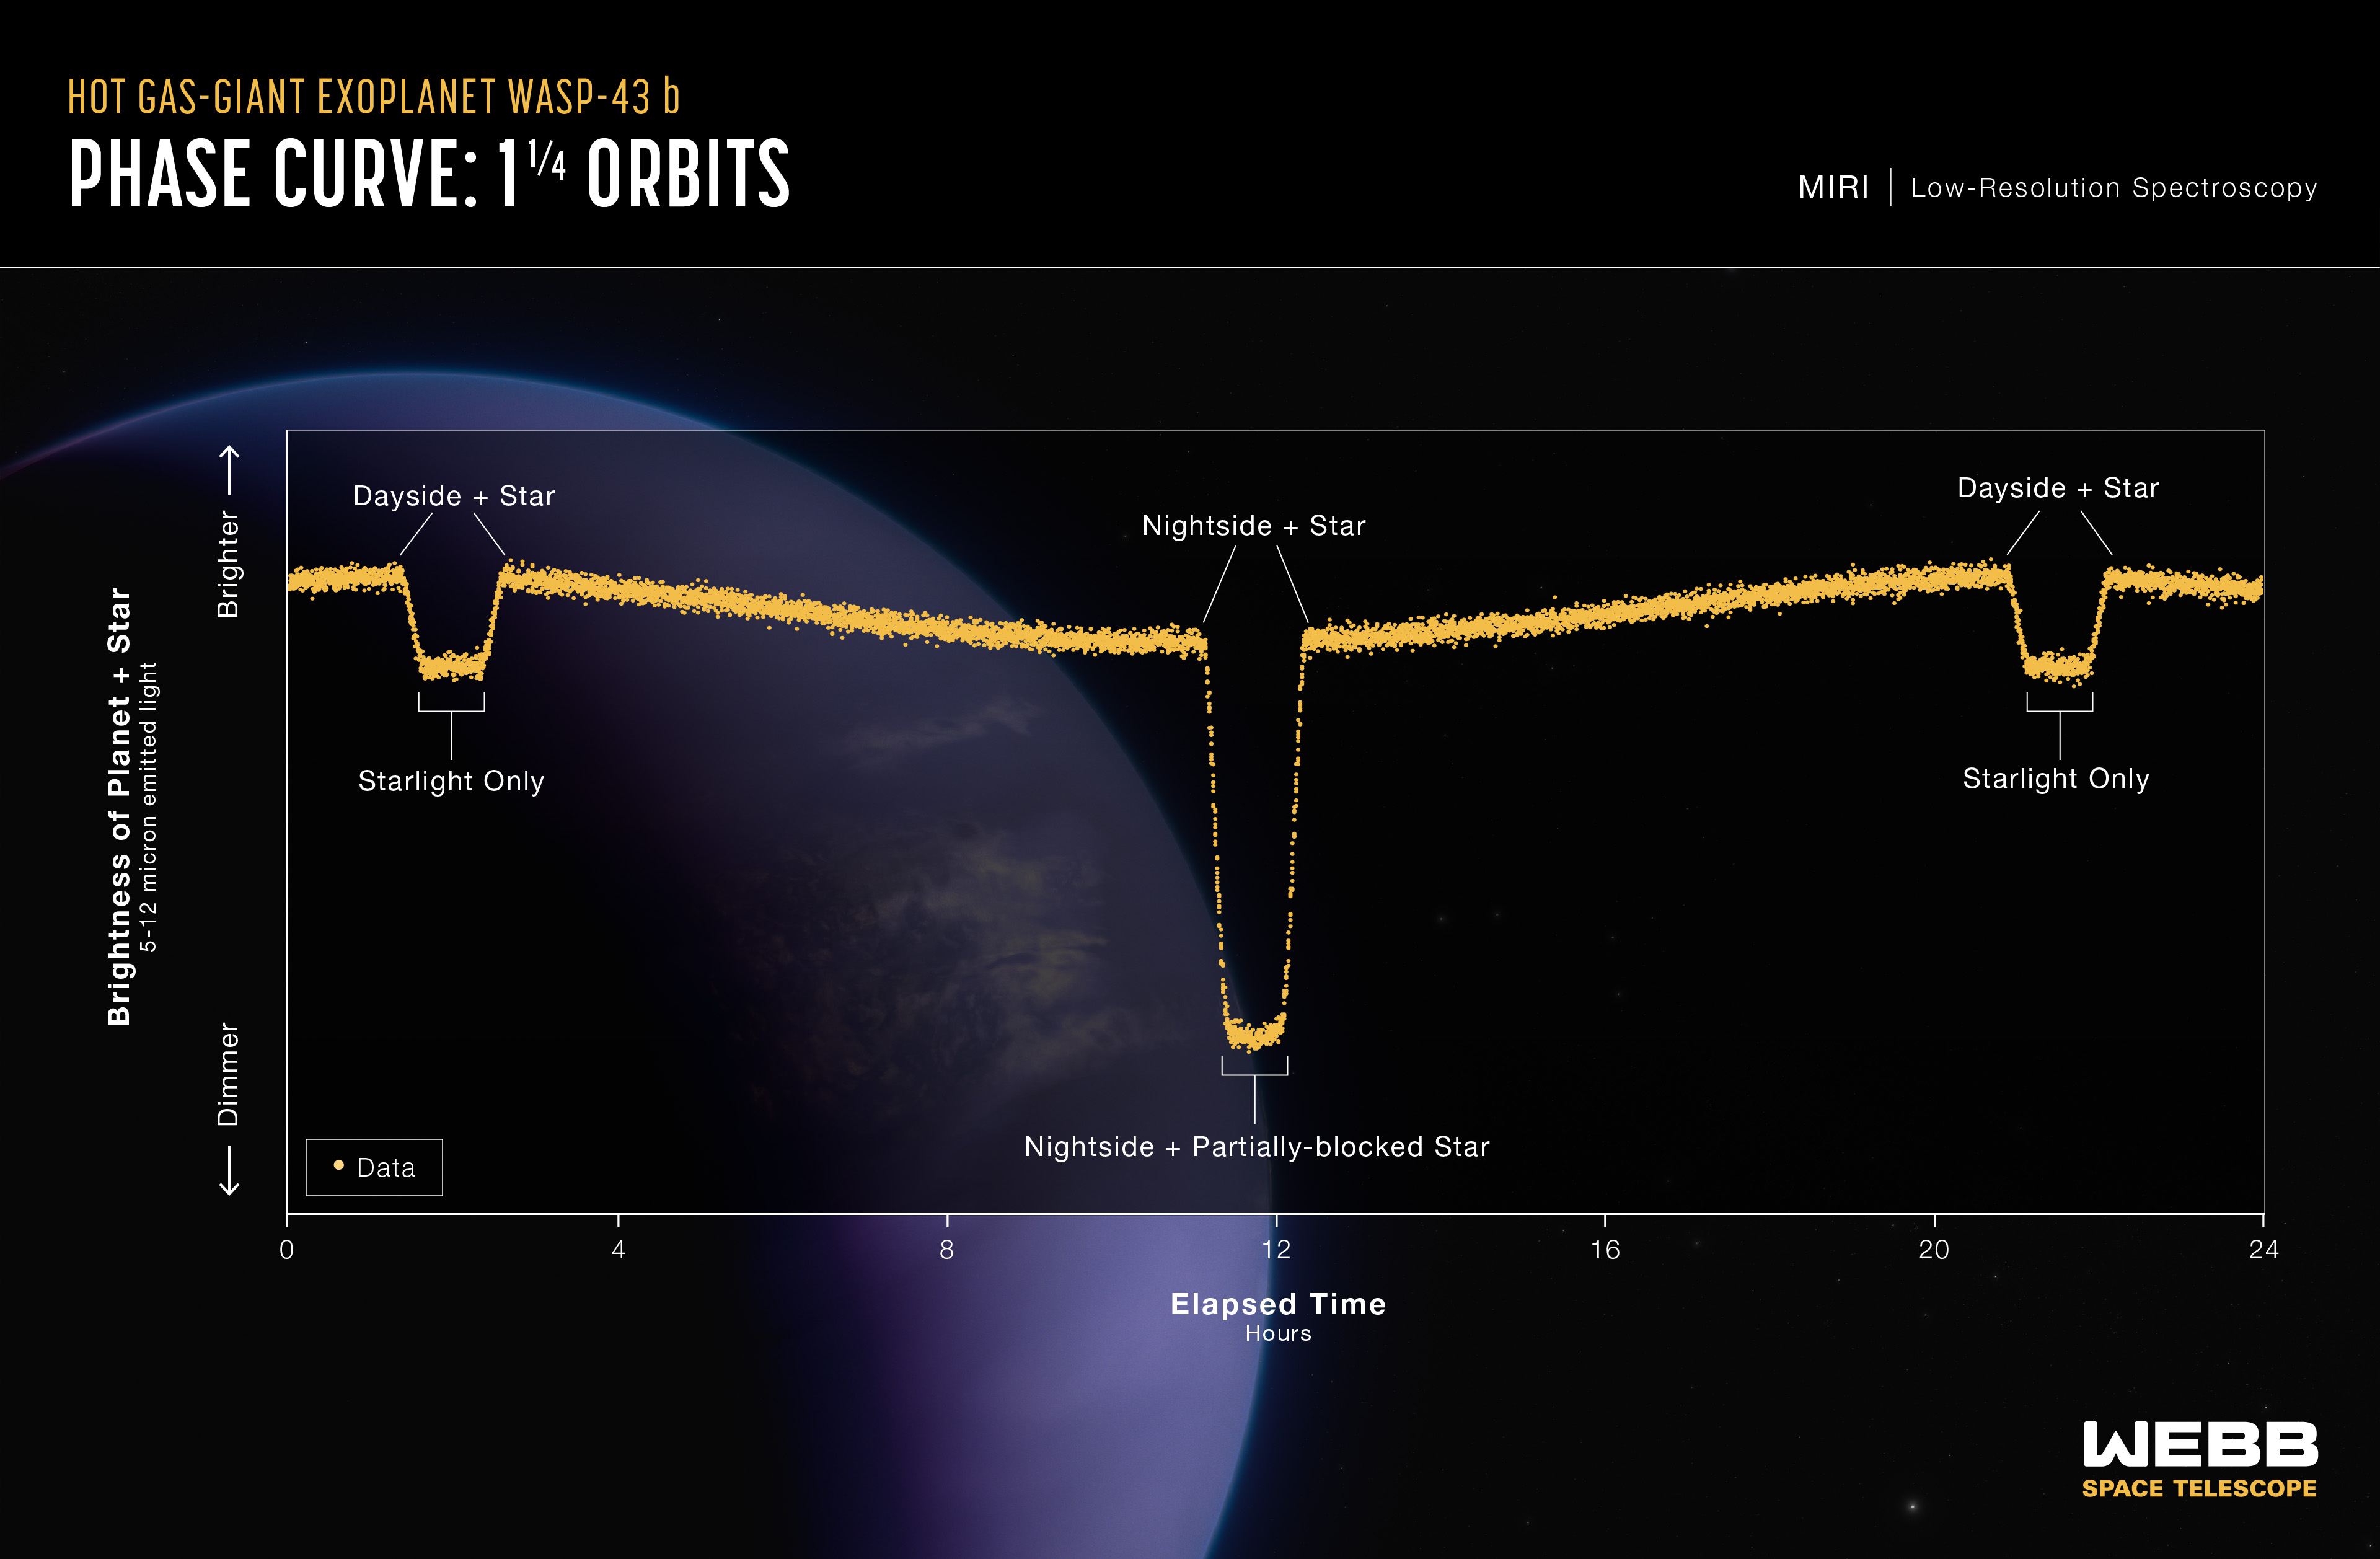
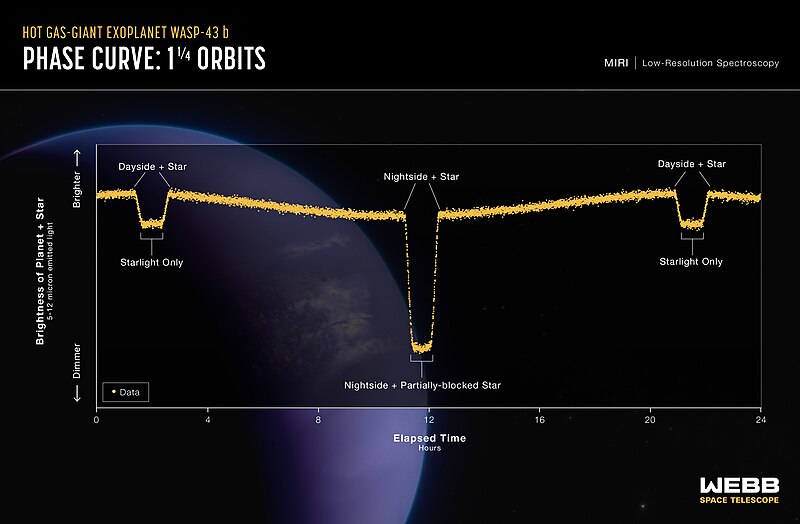
English: This light curve shows the change in brightness of the WASP-43 system over time as the planet orbits the star. This type of light curve is known as a phase curve because it includes the entire orbit, or all phases of the planet.
Because it is tidally locked, different sides of WASP-43 b rotate into view as it orbits. The system appears brightest when the hot dayside is facing the telescope, just before and after the secondary eclipse when the planet passes behind the star. The system grows dimmer as the planet continues its orbits and the nightside rotates into view. After the transit when the planet passes in front of the star, blocking some of the starlight, the system brightens again as the dayside rotates back into view. This graph shows more than 8,000 measurements of 5- to 12-micron mid-infrared light captured over a single 24-hour observation using the low-resolution spectroscopy mode on Webb’s MIRI (Mid-Infrared Instrument). By subtracting the amount of light contributed by the star, astronomers can calculate the amount coming from the visible side of the planet as it orbits. Webb was able to detect differences in brightness as small as 0.004% (40 parts per million). Since the amount of mid-infrared light given off by an object is directly related to its temperature, astronomers were able to use these measurements to calculate the average temperature of different sides of the planet. NASA, ESA, CSA, Ralf Crawford (STScI) Taylor Bell (BAERI), Joanna Barstow (The Open University), Michael Roman (University of Leicester) |
| Date | 30 April 2024 (upload date) |
| Source | Hot Gas-Giant Exoplanet WASP-43 b (MIRI Phase Curve) |
| Author | Illustration NASA, ESA, CSA, Ralf Crawford (STScI) Science Taylor Bell (BAERI), Joanna Barstow (The Open University), Michael Roman (University of Leicester) |
| Other versions |
|
| Keyword | Exoplanets |
_(2024-117).jpg&action=edit§ion=1)
Licensing[edit]
_(2024-117).jpg&action=edit§ion=2)
| This file is in the public domain because it was created by NASA, ESA and CSA. NASA Webb material is copyright-free and may be freely used as in the public domain without fee, on the condition that only NASA, STScI, and/or ESA/CSA is credited as the source of the material. This license does not apply if source material from other organizations is in use. The material was created for NASA by Space Telescope Science Institute under Contract NAS5-03127. Copyright statement at webbtelescope.org. For material created by the European Space Agency on the esawebb.org site, use the {{ESA-Webb}} tag. |
 |
File history
Click on a date/time to view the file as it appeared at that time.
| Date/Time | Thumbnail | Dimensions | User | Comment | |
|---|---|---|---|---|---|
| current | 10:30, 1 May 2024 | | 3,840 × 2,515 (603 KB) | OptimusPrimeBot (talk | contribs) | #Spacemedia - Upload of https://stsci-opo.org/STScI-01HW67TSYSFN87ZN7YW0Z0PKKG.jpg via Commons:Spacemedia |
You cannot overwrite this file.
File usage on Commons
The following page uses this file:
_(2024-117).jpg&oldid=872812205)